 (15 June 2025) After being fairly bullish through the week, stocks finished lower as Israel’s attack on Iran sparked a sharp sell-off on Friday. Not surprisingly, gold and oil rallied strongly as a result of this latest bout of geopolitical uncertainty. With the FOMC meeting slated for this Wednesday, we could be approaching an inflection point which may mark a temporary end of the post-tariff rally.
In planetary terms, there is some evidence to suggest that we could see a pullback at least. As demonstrated in previous studies, the culmination of the Jupiter-Saturn and Jupiter-Neptune squares on June 15 (today) and June 18 (Wednesday) increases the probability of declines in the day and weeks following the exact 90 degree alignment. An analysis of the past 120 years suggests that stocks tend to rise in the days leading up to the exact square and then decline as the alignments separate. While the data leans in a bearish direction, it is important to note that this is a weak correlation with a very wide variance of outcomes. Nonetheless, an assessment of the relevant influences here indicates a diminishing amount of bullish energy this week from this double square alignment, even if other bullish alignments may offset it to some extent.
Western quincunx
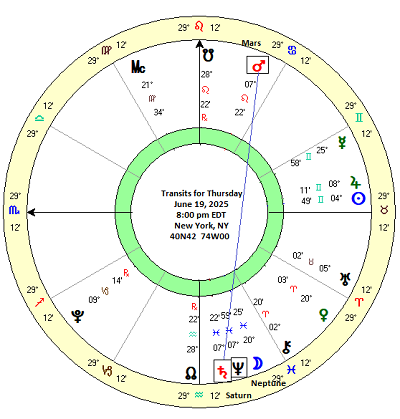
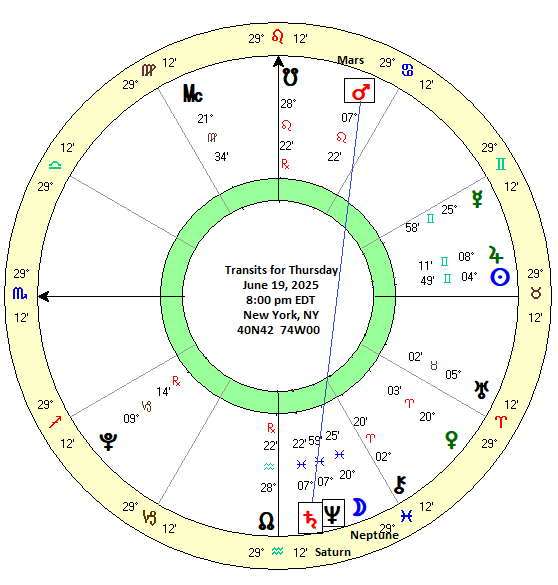
In this week’s post, I thought I would focus on a more short term alignment that is exact on Thursday, June 19. On Thursday, Mars will form an exact 210 degree quincunx with Saturn. And since Saturn is conjunct Neptune, Mars will also form an exact quincunx with Neptune the following day, June 20. As a Western aspect, the quincunx is considered to have a somewhat lesser importance. Actually, it includes two different alignments: 150 degrees and 210 degrees. In this way the quincunx defines a 6th house and 8th house relationship between two planets. Although it is a minor aspect, this 6/8 energy is seen as tense and may be more likely to coincide with troubles and challenges, especially when malefic planets are involved. Well, in this case we have two malefics: Mars and Saturn. On paper at least, there should be a greater likelihood of unwanted events and in market terms, declining stock prices.
Vedic aspecting
From a Vedic perspective, the 150 degree and 210 degree aspects are not treated equally. In fact, Vedic astrology only associates specific full-strength aspects with certain planets as each planet is treated differently. Mars does not even have a 150 degree/6th house aspect, but rather is said to cast a full-strength 210 degree/8th house aspect. For its part, Saturn only casts a full-strength aspects to the 3rd house/60 degrees, the 7th house/180 degrees and the 10th house/270 degrees. All other alignments are seen as partial strength and are often ignored by traditional practitioners. The takeaway here is that from a Vedic perspective, Mars will be casting its 8th house/210-degree to Saturn this week. And since Mars and Saturn are malefics in the Vedic system, there is some reason for caution.
Results
So what does the data show about past Mars-Saturn quincunxes, whether they be 150-degrees or 210-degrees? Based on an admittedly small dataset from 2000-2023, I analyzed the past 24 quincunxes for any market effects using daily closing prices of the Dow Jones Industrials (DJIA). I recorded prices at various intervals from 30 days before the exact alignment to 30 days after (“-30d”, “-20d”, “-10d”, “-5d”, and so on). Then I measured the price change across these intervals. My working hypothesis was that some negative outcomes should appear, probably manifesting more closely around the time of the exact alignment. And following the pattern from previous studies, the period leading up to the alignment may be more bearish than the period following.
The first column (“-30d 30d”) showed there was indeed a negative average (-0.24%) which was less than the expected value of 0.90% based on a 5.2% average annual return for the Dow in 2000-2023. And the period leading up the exact quincunx was more negative (-0.48%) than the period afterwards which as actually positive (0.30%). While this appeared to confirm my hypothesis, we should be under no illusions about the weakness of this pattern. This is a very minimal effect with a huge variance. Far from being bearish, the quincunxes from 2003 and 2007 actually registered double-digit gains. Whatever its average outcome, alignment is far too unreliable to be used as a trading strategy. And yet as part of a broader picture, it is always useful to know the relative influence of any alignments that may be in effect.
The shorter time intervals also more or less followed the same pattern of bearish before the alignment and more bullish afterwards. And the proximity rule seemed to be borne out as the most negative interval was the shortest 10-day window (“-5d 5d”) which came in at -0.50%. While this was roughly equivalent to the 30-days before the alignment (-0.48%), the decline occurred in one-third the number of days (10 vs 30), showing a more focused bearish outcome. Also we should note that both the 5 days before and 5 days after showed an average negative return.
Disaggregation of quincunxes: 150 degrees vs 210 degrees
But what happens when we divide the dataset into separate batches, 150 degrees and 210 degrees? Since the upcoming June 19 alignment will be 210 degrees, let’s address that batch first. The 210 alignment looks more bearish than the combined quincunx data.
The 60-day window of the first column (“-30 30d”) declined an average of -1.46%, much greater than the -0.24% seen in the combined dataset. However, the median was roughly the same, -0.32 compared with -0.35%. Similarly, the second column (“-30d 0d”) representing the period leading up to the alignment was more negative than the combined data (-1.29% vs -0.48%). Most of the averages are negative although some of the medians are positive. This could reflect the outsized impact of a single data point from late February 2009 when the bear market approached its early March low. Nonetheless, this 210 degree batch is more bearish than the combined 150-degree and 210-degree dataset. The “bearish before” and “bullish after” effect is also clearly in evidence here for both averages and medians.
Taking the 150-degree quincunx only, the averages and medians are more positive. The first column for the 60-day window (“-30d 30d”) was positive at 0.99% although the median was negative like the 210 degree batch at -0.87%. The before and after intervals for the 60-day window (“-30d 0d; 30d 0d”) and the 40-day window (“-20d 0d; 20d 0d”) was all positive for both averages and medians. This batch only posted negative returns for the short 10-day and 20-day time windows around the day of the exact alignment.
Conclusion
The evidence presented here suggests that the 150-degree and 210-degree quincunx alignments Mars and Saturn exhibit small bearish effects on the stock market. While the sample size was small (n=24), the 210-degree/8th house alignment of Mars and Saturn was a bit more bearish than the 150-degree/6th house alignment. Score one for Vedic astrology. And the most negative effects were felt in the 30-day period leading up to the date of the exact alignment, with the lion’s share of those occurring in a short 10-day window 5 days before and 5 days after.
In terms of this week’s market outlook, Thursday’s Mars-210-Saturn alignment is a weak bear influence. Since the most focused effects occur in the 10-day window straddling the alignment, this week and next week definitely have some bearish celestial seasonality.
The wild card here is that Mars will not just cast its 8th house quincunx to Saturn, but to Neptune also. While I don’t have direct evidence that this Mars-Neptune quincunx is bearish, this pairing has a bearish reputation in Western astrology. That said, the square and opposition may be more bearish than the 210-degree quincunx. We shall see.
But given that the bullish effects of the Jupiter-Saturn and Jupiter-Neptune squares are waning this week and next, and given the possible negative impact of Mars-Saturn-Neptune alignment, there is good reason to be cautious in financial markets this week.
Next up: the Sun-Jupiter conjunction on June 24. Will this theoretically bullish pairing be able to cut through the negativity and deliver some gains? I hope to answer that question in the coming days.


