

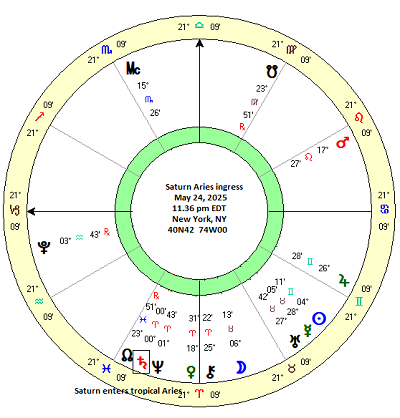
 (11 May 2025) In light of recent tariff-induced market volatility, we are on the lookout more than ever for any planetary phenomena which might signal trouble for financial markets. One such event is the upcoming entry of Saturn into tropical Aries on May 24, 2025. As a naturally malefic planet, Saturn’s condition needs to be carefully monitored at all times. Planetary alignments involving Saturn are therefore more likely to be associated with falling markets.
For this reason, we should pay extra attention when Saturn changes signs. It is generally assumed that Saturn becomes unstable and more malefic around the time that it leaves one sign and enters another. Thus, it is theoretically plausible that Saturn’s 0 degree position in any sign may be more correlated with unwanted or unpleasant events. Since Saturn is considered debilitated and weakened in the sign of Aries, its ingress into this sign may be even more portentous.
In a previous study, I examined the possible market effects of the entry — or ingress — of Saturn into the sign of Aries. As a distant and relatively slow-moving planet, Saturn changes signs about every 2.5 years, although the ingress into Aries only occurs once every 29-30 years. Since US stock market data only goes back 130 years, this creates a problem for undertaking statistical analysis. With only four previous instances of the Saturn Aries ingress, it is difficult to make any general assertions about its likely effects on market sentiment.
Despite the scarcity of data, my study from two weeks ago had some intriguing takeaways. While there was no consistent effect with the Saturn ingress into Aries in those four cases, it is important to note that not all ingresses are created equal. That is, some ingresses occur only once while others are protracted due to the Saturn retrograde cycle. Some ingresses therefore occur three times — the first ingress at 0 degrees of Aries, the second retrograde ingress back into Pisces about 1-3 months later, and the third and final ingress into Aries as Saturn returns to its normal forward motion about 6-9 months after the initial first ingress.
This triple Aries ingress occurred in 1937-1938 when the stock market fell by 45%. The other Saturn ingresses into Aries occurred only one time each, i.e. the retrograde cycle of Saturn did not back over the 0 degrees of Aries point. Significantly, the ingresses of 1908, 1967 and 1996 did not coincide with market declines. In fact, stocks were significantly higher during the Saturn ingresses of 1908 and 1967.
Like 1937, the Saturn Aries ingress in 2025 will be a protracted affair with Saturn crossing the sensitive 0 Aries point three times: on May 25, on September 1 while retrograde and finally on February 13, 2026. Does this mean that we will see a bear market in 2025 that echoes 1937? Not necessarily, since a single case cannot be the basis of a serious prediction. Nonetheless, the similarities of the triple ingress in 2025 and 1937 are worth considering.
Expanding the sample size
If we need to expand the sample size of the study, we can include all Saturn sign ingresses in order to see if there is a general influence. At the same time, we should remember that any overall effect derived from all twelve Saturn sign ingresses may not be directly relevant to the upcoming Aries ingress. Nonetheless, it is useful to know if there are any price correlations with significant 30-degree alignments with the 0 Aries point (i.e. the spring equinox). The key assumption here is that ingresses into.say, Taurus and Gemini, for example, have something in common since they represent 30-degree and 60-degree alignments with the 0 Aries point.
For the current study, I compiled a data sample of 48 previous tropical sign ingresses from 1967 to 2023. These included all ingresses regardless of whether Saturn was moving forward or retrograde. These were later sub-divided into categories of stand-alone single ingresses (like 1908, 1967 and 1996 in the previous study of the Aries ingress) or triple ingresses that included Saturn’s retrograde cycle. The latter category of ingresses were further divided depending on whether it was the first, second or third ingress.
Results
The results are quite surprising. Despite Saturn’s bearish reputation, the tropical ingress into all 12 zodiac signs do not show any clear negative correlations. In fact, the Saturn ingress is generally bullish across most of the time intervals tested. The first column (“-20d 0d”) measures the average difference in price in the Dow Jones Industrials between 20 days before the ingress and the exact date of the ingress. This 20-day time interval showed an average gain of 1.02%, somewhat above the expected value of 0.40% based on an average annual return of 7.2%. Almost three-quarters of the ingresses were positive. And it is worth noting that this better than expected result included a massive 28% decline in March 2020 near the bottom of the Covid crash.
Actually, the March 24, 2020 low during Covid occurred just 3 days after Saturn’s ingress into Aquarius. While this seems too close to be mere coincidence, we should note that other planetary alignments were likely more important such as Saturn’s conjunction with its south planetary node and the conjunction of Jupiter and Mars with the south planetary node of Pluto, to mention just two. Nonetheless, whatever the general bullish bias of the tropical Saturn ingress, there may also be a simultaneous increased downside risk, as illustrated by the 2020 and 1937 cases.
The second column (“0d 20d”) shows the price difference between the date of the exact ingress and 20 days later. This was even more bullish that the preceding 20-day window with an average gain of 1.70%, more than 4 times the expected gain based on the long-term average. The third column (“-20d 20d”) reflects the overall effect of the 40-day window around the ingress and saw an average gain of 2.61%, well above the expected value of 0.80%. Most of the other intervals posted averages that exceeded the expected value.
The only interval that showed a negative result was the narrowest time window — from two days before the ingress to two days after (“-2d 2d”) which had an average change of -0.35%. This was the only evidence in support of the widely-held view that the Saturn ingress should be bearish. It is indeed bearish, but only very slightly. Only 42% of cases were positive, suggesting that we cannot attribute the negative result to just the outsized 2020 decline. There clearly is something bearish about Saturn changing signs, although it is likely too small to make much difference in terms of trading strategies.
First Ingress
Next, we want to see which ingress may be more of a market-mover. It is possible that the first ingress could be stronger in its effects — bullish or bearish — since it represents the initial shift of energies from one sign to another. In all, there were 24 first ingresses which include both single ingresses and the first of a triple ingress. These data suggest that while the first ingress is still somewhat bullish, it is less bullish than the other three types of ingresses. The first column (“-20d 0d”) shows the average price change during the twenty days leading up to the exact ingress. This average was actually negative — -0.24% — although that bright neon decline from 2020 is most of the reason for it. The fact that the median change was still positive (0.81%) and greater than the expected value of 0.40% and that the number of positive cases was 67% suggests the first ingress was mostly bullish. Other intervals were more bullish although only slightly more than the expected values would predict. As with the larger 48 case sample, the smallest 4-day window (“-2d 2d”) straddling the exact ingress was actually negative at -0.34%.
Second Ingress
The second ingress occurs when Saturn is retrograde as it backs out of its new sign and into its preceding sign. These results suggested a somewhat more bullish effect as the first three columns had larger average gains than the first ingress, with the 40-day window (third column, “-20d 20d”) registering an average gain of 4.34%. This is five-fold increase from the long-term average return for stocks of 0.80% for any 40-day period. As with the other batches, the 4-day window around the ingress date (“-2d 2d”) was negative with an average decline of -0.68%.
Third Ingress
The third ingress occurs after Saturn completes its retrograde cycle and resumes normal forward motion and re-enters the new sign. The results display the similar pattern of bullish outcomes across most time intervals with the 40-day window (third column, “-20d 20d”) exhibiting the largest average gain of 4.02%. This is roughly on par with the bullish bias of the second ingress, although this batch produced higher rate of positive outcomes at 92%. While the number of cases is quite modest at 12, there is some reason to believe that the third ingress of Saturn is the most bullish of all. As with the other ingress types, the 4-day period immediately before and after the ingress (“-2d 2d”) was slightly negative at -0.04%. Since only 33% of cases were positive, there is clearly some bearish effect here, even if it is very modest.
Single Ingress
The single, stand-alone ingress is the final type of ingress to consider. This occurs when Saturn’s retrograde cycle does not entail any sign ingress at all. Instead, it enters a new sign only once and then continues in its normal forward motion. The results are broadly consistent with the previous ingress types. The outcomes are generally bullish with the 40-day window (third column, “-20d 20d”) with an average gain of 3.04% with 75% of cases being positive. Given the similarly small number of cases (n=12), it is difficult to distinguish any effect between this type and the others discussed above. Similarly, there is underperformance of price in the 40-day window (“-2d 2d”) of just 0.01%, although it was not quite negative as with the other types.
Conclusion
This analysis suggests that Saturn’s reputation as a bearish planet for the stock market may be undeserved. If the tropical ingress is commonly associated with a more malefic expression of Saturn’s nature, the data suggests that this is a mistaken belief. Across almost all time intervals and ingress types, the Saturn tropical ingress is actually more bullish than chance would predict using long term averages. This is best observed in the longer 20- and 40-day intervals which show a significantly larger average gain than the expected value. And while it is difficult to be definitive, the 20-day period after the ingress seems to be somewhat more bullish than the 20-day period that precedes it.
Of course, some caveats apply. The sample size is very small (n=48) and thus the result cannot be considered statistically significant by any conventional measure. And yet the consistency of the data is reason enough to be open-minded about the possibility of real effects that could be proven more conclusively with a larger dataset. The other caveat is that is the market effect of Saturn ingress may not be large enough to warrant its use in any trading strategy. As with so much in astrology, single variable effects are fairly small. Overall market outcomes are more likely to be linked to multiple alignments and planetary conditions rather than any one factor. As a rule, prediction in astrology requires a multi-factor model. This was true in the case of the Saturn ingress into Aquarius in March 2020 during the Covid crash and is no less true during the 1937 bear market when Saturn ingressed into Aries. Other alignments were likely more important in accounting for the decline, even if the ingress has its own role to play.
And yet given its bullish bias, it is hard to reconcile how a Saturn ingress may figure into a larger market sell-off. It may be that ingress periods are primarily unstable and highly energized and only secondarily bullish in their effects. Thus, we may be more likely to see larger moves in either direction around the time of the Saturn ingress, depending on the alignments of other planets. The ingress therefore becomes a multi-directional source of energy which can move the market in both directions.
Implications for the Saturn Ingress on May 24, 2025
More immediately we must concern ourselves with the approaching ingress into tropical Aries on May 24. As noted in my previous study, the Aries triple ingress carries a certain negative connotation given the bear market that unfolded in 1937 under a similar triple ingress into Aries. And yet we cannot ignore the fact that, on average, Saturn ingresses may actually be bullish, except for the 4 days around the time of the exact ingress. That would translate here to a period from May 20 to May 28 which could be a bit more more vulnerable to declines. For the more bullish 40-day window, that would equate to May 4 until June 13.
As far as co-factors are concerned, Saturn’s conjunction with Neptune in June and July is a potential trouble spot. This somewhat reduces the likelihood of an ingress that is bullish, especially in the period following May 24 when Neptune moves closer to Saturn.
The relatively small effects and large margin of error means we cannot presume any necessary effect of the ingress on May 24. The overall bullish bias seems justified for that May 4-June 13 period but it is not something that is directly applicable in trading. Given the 1937 example, we cannot rule out a strongly negative outcome either. In that sense, we may say with more confidence that the ingress of Saturn into tropical Aries will increase the likelihood of larger market moves in either direction.
At some point in the near future, I would like to undertake the same study using the sidereal ingress of Saturn and compare the results. Since I generally use the Vedic sidereal zodiac (Lahiri/Krishnamurti), I believe that there is a stronger bearish effect with Saturn sidereal ingresses. I am curious to see if the data justifies my belief or if I will be proven wrong. The next Saturn sidereal ingress is due to take place on June 2, 2027.
However, the previous ingress into sidereal Pisces occurred on March 28, 2025 at the height of the Trump tariff chaos. Taking that same 40-day window which extends from March 8 until April 17, we note that stocks fell 6%, and the window included the April 7 low which was 16% below the March 8 closing price. Such a study would endeavor to show if that was a one-off coincidence perhaps associated with more important co-factors or if that was part of a larger bearish influence of Saturn ingresses in the sidereal zodiac.
A comparison study between tropical and sidereal Saturn ingresses would therefore be a constructive addition to the long-standing debate between tropical astrologers and sidereal astrologers.
