

- Increased volatility with a negative bias
- Dollar strong Monday and Friday
- Gold could be higher early and midweek with declines later
- Crude choppy with downward bias
- Increased volatility with a negative bias
- Dollar strong Monday and Friday
- Gold could be higher early and midweek with declines later
- Crude choppy with downward bias
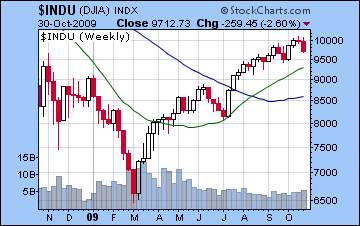
Stocks made a decisive move lower last week as flagging consumer sentiment fueled doubts about the sustainability of the recovery. Not even Thursday’s positive Q3 GDP report was enough to reverse the trend as the the S&P lost 4% for the week to close at 1036 while the Dow finished at 9712. This result was largely in keeping with expectations as the tense Sun-Mars aspect negated any favourable influence from the passing Venus-Jupiter aspect. I had wondered if we might see some bullishness early in the week, especially Monday as the Moon would punctuate the approaching Venus-Jupiter aspect. In fact, the market rose in the morning only to give up gains and then some by the close. The failure of the market to stay afloat on that otherwise positive aspect is a signal of significant weakening of medium term bullish influences. The difficult Mercury-Saturn influence was felt Tuesday and Wednesday and came off more or less on cue. The most glaring anomaly was Thursday’s sharp 2% rally on the GDP data. I had omitted specific consideration of this day in last week’s newsletter, and preferred to fold it into more general description of late week bearishness on the Sun-Mars square. Fortunately, Friday’s pessimistic Moon-Saturn aspect delivered a significant decline so the late week period was negative overall and we closed down for the week.
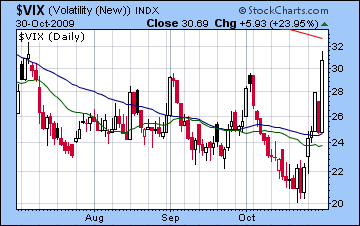
It seems the bloom is off the rose here as markets are breaking below significant support levels. The S&P closed Friday below its 50 DMA, although we should be careful in assigning too much weight to a close that is merely 1% below a moving average. Perhaps more important was the break below the rising wedge support levels at 1050. Thursday’s one-day rally after the lows at 1042 can be seen as an attempt by bulls to reclaim the wedge. But Friday’s sell-off took the legs out from under that effort and now the market looks to be in a more precarious technical position. Volume is still fairly low, which, given the down move, may give some solace to bulls. However, I would point out that volume on both big down days last week, Wednesday and Friday, was larger than it was for the up day on Thursday. RSI stands at 41 and in a distinct downtrend. It has not seen these levels since July’s correction and suggests the possibility that the correction is not yet done. MACD is extremely negative here as both lines may be headed into negative territory for the first time since July. We can see more evidence of a negative divergence by comparing recent lows — Friday’s close was higher than the low in early October but MACD was measurably lower. This also opens the possibility for future declines. Meanwhile, the VIX spiked to 30 on Friday, a sign of increasing concern about lower prices down the road. Somewhat surprisingly, last week’s decline has done little to affect the moving average of the put-call ratio, which still stands below 0.60. As a contrarian indicator, this suggests that the accumulated complacency of the previous weeks and months may require more volatility before it makes a significant move up. The next major level of support may lie in the 980-1000 area which coincides with the August-September lows. Even if the market is intent on retracing, it may find some temporary support around there before attempting to move towards the 200 DMA around 920.
 This week also looks negative, albeit with the possibility of gains midweek, perhaps coinciding with the FOMC meeting on Wednesday. Monday features a Full Moon and a number of tight aspects that may produce a sizable move. As a complicating factor, we can see both positive and negative planets involved here. Venus forms a favourable aspect with Uranus and Neptune while Mercury and Mars are in a tense square aspect Since I’m bearish this week, I would think a decline is more likely Monday and possibly into Tuesday. One potential reversal period might be Tuesday morning or midday when the Moon comes under Rahu’s aspect and then changes sign to the more positive Taurus. I think the most likely scenario is a reversal up on Tuesday or perhaps as late as Wednesday as the Sun conjoins Mercury. This is often a positive aspect so we should expect at least one solid up day perhaps equaling a 2% gain. Wednesday will also feature a Neptune direction station as it ends its four month retrograde cycle and begins to move forward. While this is unlikely to mark a significant change in market direction, it could well manifest as a short interlude when hope and delusion, as symbolized by Neptune, supersedes other planetary influences. Thursday could go either way in the aftermath of the Sun-Mercury conjunction although I would lean towards a negative close. Friday also seems quite bearish as Mercury forms a minor aspect with Saturn, with the afternoon being more vulnerable. Overall, we could see an even greater decline this week, keeping in mind some kind of up move will ameliorate the worst of it. I would not be surprised to see SPX break below 1000 here on either Monday or Friday.
 Next week (Nov 9-13) is likely to start out bearish on the Venus-Saturn aspect but may see gains by midweek as the Sun-Jupiter builds. With Saturn tightening up its aspect with Pluto this week, rallies are unlikely to get very far. The week could well be quite mixed. The following week (Nov 16-20) also looks quite choppy with any potential relief rallies tempered by some tense aspects. On the negative side, Mercury is aspected by Saturn on Monday and Tuesday while the end of the week features a minor aspect of Mercury and Ketu and a Venus-Mars square. There could be some positive sentiment with the separation of the Saturn-Pluto aspect, but this week may well end up lower. In terms of timing significant lows, I believe there is a good chance we will see an interim low formed at some point between November 9 and 20. The 9th is next Monday and it could represent some leftover selling from the previous Friday. Assuming that any midweek rally isn’t too strong, the 9th could mark some kind of short term selling exhaustion. But I am reluctant to isolate next week if only because the following week has the potential for more declines. These could well take the market lower than anything we see up to the 9th. At the moment, I would lean towards Nov 16-20 as marking the low before we see any kind of meaningful rally. As it is, the rally may be fairly short-lived and seems destined to last only until the first week of December. Watch for the bears to take over once again by Friday, December 4 or Monday, December 7. If we only see a pullback to SPX 950-1000 in November, then the decline into January will more than likely be deeper, possibly to 800. The market will be facing up the reality of a double dip recession soon enough, and that will crush optimistic expectations and take prices significantly lower.
5-day outlook — bearish
30-day outlook — bearish
90-day outlook — bearish
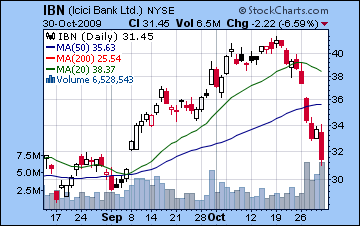
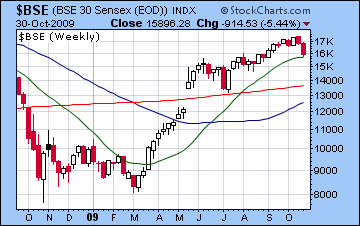
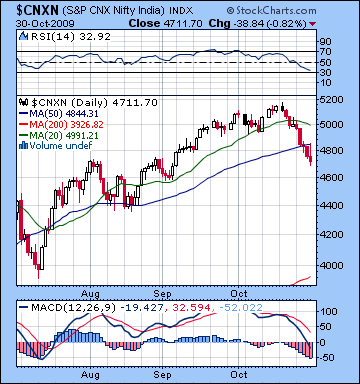 Despite some positive earnings reports from ICICI last week, Q2 results and global cues weighed on Indian markets as stocks slid 6%. Equities lost ground on all five trading days as the Sensex ended Friday’s session at 15,896 while the Nifty finished at 4711. This bearish outcome was largely in keeping with expectations as the double dose of debilitation in the Sun-Mars aspect took precedence over everything else as the tense fallout from this fiery combination permeated through most of the week. I had thought we might see an up day early in the week on the Venus-Jupiter aspect but it failed to reverse the other available energies. As always, astrology is an imprecise assessment of potentials where one has to accept the inconclusive nature of the information under consideration. The failure of this bullish aspect to manifest at all is another sign of the strengthening of more bearish medium term influences that appear to be determining price movements now. Wednesday and Thursday were negative as expected on the Mercury-Saturn aspect and Friday saw the pessimism from the Moon-Saturn combination take the market lower, although perhaps not as much as US or European markets which bore the full force of this aspect during their respective trading days.
The correction seems fully underway here as the key indices have broken through key support levels. So far, we’re down about 9% off the highs which fulfills the notion of a standard correction. The Nifty fell below its support from the rising wedge trendline at 4800 and is therefore in a somewhat precarious position. It should be noted that the breach amounts to a mere 2% and therefore it should be seen as potentially reversible. Nonetheless, I believe this is a significant break down of the rally which will push the market lower in the near term. Prices also fell below the 50 DMA with Friday’s session, and is another indication of future declines. In a similar fashion, prices fell 5% below the 50 DMA during the June-July correction so that it something to watch for in terms of looking for a possible bottom. For its part, the 20 DMA has turned lower signaling a reversal of the prevailing trend. The 20 DMA also turned lower during the July bottom so that is a possible important point of comparison here as we account for developments. At that time, the 20 and 50 DMA had a bearish cross which given the shallowness of the correction actually marked the resumption of the rally. A similar crossover is very possible in the days ahead but will require another major down week. After that, the market could then move lower still or bounce as the bulls try to reassert themselves. RSI has deteriorated sharply here and stands at a bearish reading of 32. MACD is also trending down and has now moved into negative territory, which is another signal that a correction is underway. The break below the 4800 level increases the likelihood of a major pullback in November — perhaps down towards 4000 on the Nifty. It’s still not certain though, since much will depend on what kind of early week selling we get here. If it’s fierce, then the deeper pullback scenario looks more likely. If it’s tempered and we only move down to 4500-4600, then there may not be enough bearish energy left to take stocks towards 4000 in November. For that, we would have to wait for December and January. As I noted previously, it seems the market will be correcting back to 4000 or below over the next three months in any event, although amplitude and timing of the declines remains an open question.
 This week seems likely to continue the downdraft although Monday’s holiday closing may complicate matters somewhat. Monday will feature a close aspect between Mercury and Mars, but with Indian bourses closed, the energy may have to wait until Tuesday to manifest. By that time, however, we will see a building of a potentially bullish Venus-Rahu aspect. It seems unlikely that Indian markets will be able to shrug off Monday’s probable global sell-off but it is conceivable. Perhaps the more likely scenario is for a large down open with some recovery near the close with indices closing in the red. Gains are more likely Wednesday or Thursday as the Moon transits Taurus while Venus is in Libra. I would not rule out two positive trading days here, especially if Tuesday is deep in the red. Thursday features a Sun-Mercury conjunction which often coincides with up days. Friday seems more bearish again as Mercury forms a minor aspect with Saturn. If there has been a partial recovery in prices by Thursday, Friday is likely to negate most of those gains. Picking the low of the week is difficult, however, since Friday’s probable decline may be fairly close in magnitude to whatever rally we see beforehand. Overall, we should be down this week.
 Next week (Nov 9-13) looks fairly mixed although with a bearish start as Venus aligns with the Saturn-Pluto aspect on Monday and perhaps Tuesday. Some gains are more likely on the Sun-Jupiter aspect midweek although I would note a certain ambiguity here since that bullish aspect coincides with a more bearish Mercury-Ketu aspect. I would lean towards a large gain as the probable result on either the 11th or 12th. The following week (Nov 16-20) looks more bearish again as Mercury comes under the influence of Saturn early in the week while there is a square aspect between Venus and Mars at the end of the week that also may inhibit investors taking new positions. The 19th or 20th look like the low for the week and may also turn out to be significant interim lows. Whether they do depends on how deep sell-off is at the end of this week and the beginning of next (Nov 6 and 9). Some kind of rally seems likely for the last part of November and early December as Jupiter conjoins Neptune. Given the relative brevity of this period, it seems unlikely to take the market significantly higher, although a 50% retracement between the high (5181) and whatever lows we make in November is very possible. Things may fall apart fairly quickly after that as a very nasty Mercury-Saturn-Pluto alignment on 7 December is likely to take the market down hard and may set the stage for another leg down into January.
5-day outlook — bearish
30-day outlook — bearish
90-day outlook — bearish
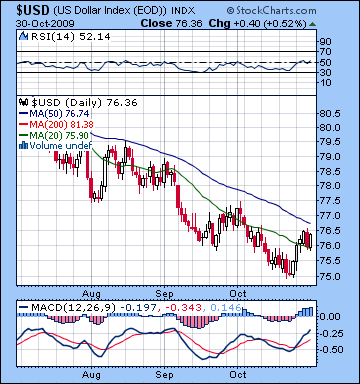 After weeks of waiting, the US dollar finally saw a winning week as investors sought out a reduction of risk on the equities pullback. Although it didn’t quite make it to the critical resistance level of 77, it nonetheless closed well above 76. This result was more or less expected on the Sun-Mars square and favourable patterns in the natal DX chart. Thursday’s decline was likely the result of the Saturn-to-Saturn aspect. Although I thought it might manifest Tuesday or Wednesday, I did acknowledge that its slow speed meant that a decline was possible on any day of the week. While the dollar has broken above the 20 DMA, it has another cent to go before it enters the promised land of the 50 DMA at 77. Even when it does, there’s no guarantee it will shoot higher since the falling wedge of this long duration enjoys a certain plasticity. But other indicators are suggesting that we are not far off a significant break out. First, the RSI has climbed into bullish territory at 52, achieving roughly the same levels of previous failed rallies during this lengthy decline. If it managed to squeeze just a little higher, it may be able to take advantage of entirely new dynamics. MACD has turned higher also and is within striking distance of positive territory as it continues to etch out a bullish divergence. Perhaps most encouraging is that UUP (not shown), the ETF for dollar bulls saw a near tripling of normal volume last week indicating that pressure may be building for a big move up very soon. My call for a dollar rally these past few weeks has proven to be overeager but things appear to finally be coming to a head.
This week could see some early gains but the prospect for midweek selling reduces the chances that the dollar will break above 77. Monday’s Mercury-Mars aspect will likely see significant gains that could lift the dollar near 77 but transiting Mars forms a square midweek with the natal nodes in the DX chart that looks less likely to manifest in bullishness. The dollar will likely turn bullish again late Thursday and Friday as the Sun-Mercury conjunction will fall on top of the natal Venus. This is an excellent influence and could boost it by 1% in a single session. If we don’t see a major break out this week — and after so many disappointments I fear we may not — then the next candidate would be the following week on November 9-10. The dollar generally looks positive until November 20 but it will be subject to correction from this recent rally over the subsequent week or two. Generally the dollar looks strong going into 2010 with early March looking to be a significant high, possibly over DX85. It will be interesting to see how the dollar’s current inverse relationship with equities evolves over time. While this Obama stimulus rally has been entirely at the expense of the greenback, it’s not clear that the lines of demarcation will be as neat once the dollar changes course in this upward trend. At first, the relationship will be maintained as equities will sell-off sharply but that zero-sum game may normalize somewhat as the winter progresses. This will be something to watch out for.
The Euro gave up some of its recent gains as it fell back to earth closing Friday at 1.47. This was basically in line with our forecast as Mercury transiting opposite Saturn created enough bearishness Monday for a big decline that set the tone for much of the week. Thursday’s gain was somewhat puzzling although given my fairly conservative position on the Euro last week, perhaps it wasn’t altogether surprising. The Venus-Jupiter aspect set up on the natal Mars in the Euro chart and that seems to have been enough for the one cent gain. The fact that it promptly gave it all back the next day is a sign that the brutal Saturn-Pluto square that is setting up on the natal ascendant may be about to get very bearish here as it fills the gaps between aspects. This week may start off bearish as Mars forms a minor aspect with Uranus while in an alignment with the natal nodes. After some midweek gains which may arrive as early as Tuesday, Thursday and Friday are looking quite bearish as Venus opposes natal Saturn so that could generate declines of over one cent. So we could be down a little this week overall, although that is not certain. Nonetheless, the Euro is confronting a difficult aspect in the Ketu trine to the natal Jupiter which is backed up with the Uranus conjunction. Ketu’s ethereality and Jupiter’s taste for wealth don’t usually mix well, and this may represent a symbolic draining of value of the Euro over the next couple of weeks. As expected, the Rupee traded lower last week, closing at 47.3. The Sun-Mars aspect reduced the appetite for risk with most world currencies suffering in the wake of the flight back to the dollar. This week could well see further weakening over 47.5 and perhaps to 48 by Friday/next Monday.
Dollar
5-day outlook — bullish
30-day outlook — bullish
90-day outlook — bullish
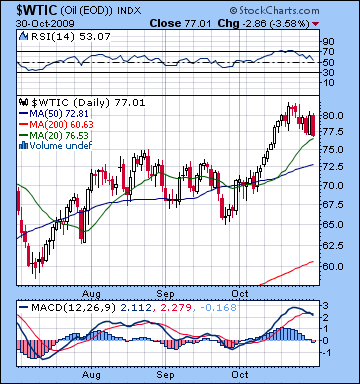 Investors got spooked with some iffy economic data last week, as the dollar strengthened and crude oil slipped back to $77. Most of the bearish energy came from the Sun-Mars square which enjoyed extra effects due to its set up on the Saturn-Rahu in the Futures chart. Monday was down as expected and we did see a small gain Tuesday as I thought we might with the Venus-Jupiter aspect. While I was mostly correct in calling for bearishness after that, Thursday’s rally was quite unexpected. One possible explanation was that the aftermath of the Venus (24 Virgo) – Jupiter (23 Capricorn) aspect was revived by the passing Moon (24 Aquarius) in the same degree. By Friday, Mercury conjoined the natal Moon-Saturn conjunction and pushed prices down sharply. The technical picture for crude looks quite mixed here as MACD has turned down and has begun to form a bearish crossover. RSI at 53 is declining although it remains in the bullish zone. It should also be noted that there are no clear bearish divergences in these charts, which may give some support to bulls. Both 20 and 50 DMA are still rising and prices remain safely ensconced above both.
This week may see crude correct further although trading may be choppy. Monday seems negative as the Moon in Aries will transit the 12th house in the Futures chart. At the same time, I should point out one possible bullish placement, that of Venus in positive aspect with Uranus and Neptune. By itself, this could produce gains but the co-presence of Rahu and Ketu in very close harmonic aspect to these combination may undermine the whole thing and render it negative. At least, that is my expectation. We should see one or two days of gain on the Sun-Mercury conjunction, most likely between Tuesday and Thursday. Friday is again problematic as transiting Mars forms a powerful configuration with Sun and Uranus in the Futures chart which should take prices lower. Early next week looks every more negative as Mercury sits on the malefic 6th house cusp receiving Ketu’s toxic aspect. If these nodal aspects deliver as expected in the next two to three weeks, we should see crude correctly sharply, possibly back below its July lows. If they don’t, then we will be looking at a sideways market that culminates with a short rally. With the dollar slated to pick up steam in the weeks and months ahead, we can expect a significant sell-off in commodities over the next 90 to 120 days.
5-day outlook — bearish
30-day outlook — bearish
90-day outlook — bearish
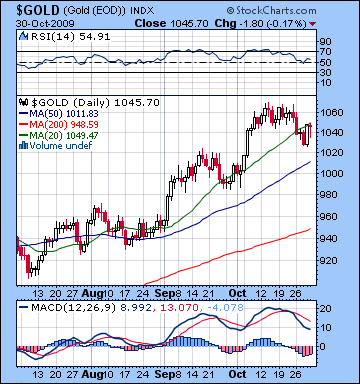 With the dollar showing signs of recovery, gold slipped back modestly to $1045 last week. While I had been bearish on the Sun-Mars aspect, the pullback was a little disappointing particularly since gold did not follow equities and other commodities down on Friday. This may be an important clue to gold’s special staying power in the near term in case there is a full fledged dollar rally and stock correction. The GLD chart played out more or less as expected last week as the Sun (11 Libra)-Mars (11 Cancer) square set up on the natal Mars (11 Libra) on Monday and its potent influence lingered until Wednesday. Thursday’s impressive rally was more of a mystery, however, given Mercury’s difficult conjunction with the natal Ketu. The Venus-Jupiter aspect set up on the natal Moon quite closely so that may have had an important influence on the overall bullish outcome late in the week. The technical picture is mixed as MACD has turned lower but only shows partial negative divergences in the lows. RSI at 54 is bullish but still in a decline. While gold may have fallen to its 20 DMA, the 50 DMA is a more important support level and until it tests 1000-1010, gold should be on fairly solid footing.
This week will be an important test of the strength contained in the tight Jupiter-Moon conjunction in the ETF chart. This aspect has been keeping prices aloft for the past several weeks and it may well keep them up for another couple of weeks. As a medium term influence, however, it is harder to ascertain just what its relative role is in the price picture when stacked up with other faster moving aspects. It also may have to confront the power of the bearish Saturn-Pluto aspect that will set up quite close to the ascendant. Transiting Venus sits at the top of the ETF chart early in the week so that ought to generate some strength. However, this would appear to be at odds with my overall forecast for an equities pullback and dollar rally. One possible explanation is that equities will continue to pullback here but gold will act as a temporary safe haven along with the dollar. Gold may still correct this week, but there are good astrological reasons to doubt it at least in the early and middle part of the week. Thursday and especially Friday look more bearish. But I can see clearer picture for a significant decline for the week of Nov 16-20. This may well have an shocking or sudden quality to it as the slow moving Mars will aspect the ascendant in the ETF chart. This decline will only be a taste of what is to come since it will be followed up by a brief rally into December. But the approaching Mars retrograde station on December 19 is going to hit gold full force since it will set up opposite of the ETF Moon. This is the time when the price of gold will really fall apart and we will see a major retracement below its 200 DMA.
5-day outlook — bearish-neutral
30-day outlook — neutral
90-day outlook — bearish