

Summary for week of May 9 – 13
- Possible rise in stocks early but declines from likely from midweek
- Dollar rally will likely continue after Tuesday
- Crude vulnerable to more losses, especially after Tuesday, correction could last into June
- Gold may stay weak with more downside possible midweek
Stocks declined last week against a backdrop of tightening monetary policy in China and India and weaker than expected domestic economic data. Despite Friday’s rally attempt, the Dow lost more than 1% closing at 12,638 while the S&P500 ended the week at 1340. While I thought there was a good chance for some early week losses on the Mars-Rahu aspect, the mood stayed bearish for longer than expected with the bulls asserting themselves only on Friday. This negative outcome confounded my expectations for some upside as we headed into the Jupiter-Rahu aspect this week. On the other hand, I did note that the bullish effects of the approaching Mercury-Venus conjunction were perhaps somewhat less reliable since the aspect was not quite exact. In this sense, the failure of the market to rally higher was not a huge shock and indeed since I am expecting more downside in the near term, it was a welcome development.
The huge moves in the currency and commodity markets this week confirm the growing impact of the Jupiter-Rahu aspect. Rahu is distorting and interfering with this speculative market so that the bubbles are in the process of popping. All of a sudden, the risk trade doesn’t look so attractive. The silver market experienced the sharpest sell-off as the CME tightened its margin requirements. The central banks of China and India both moved to tighten their monetary policy last week as inflation is continuing to be a major problem in those economies. Authorities are increasingly willing to accept a reduction in growth as long as inflationary pressures can be kept in check. All of this speaks to a new recognition of the downside risks to inflation and endless speculation. As I have pointed out previously, gains obtained under Jupiter-Rahu are unlikely to be sustainable in the long term as Rahu has the tendency to undermine itself. What is important here is that the whole risk trade is threatening to come unhinged as these commodity and currency bubbles rapidly unwind. While we didn’t see similar moves in stocks last week, I believe the moves in these other markets may well foreshadow similarly large moves in equities in the near term. The rise in the US Dollar is perhaps the most significant development for stocks since so much of the Bernanke rally in stocks has presupposed a devalued greenback where investors seek value in riskier assets. Now that the Dollar appears to be finding its feet again and is moving up, there may be a significant move back to the Dollar and out of other riskier asset classes. If the Dollar continues to move higher above its resistance level, then this could spark a rush out of equities. I doubt that we’re close to such a crash-type scenario here, but there is nonetheless good reason to expect more weakness in stocks as long as the dollar appreciates.
 It was a big set back for the bulls last week as the neckline in the IHS was violated to the downside. Bulls had been counting on that IHS pattern playing out and taking the SPX all the way to 1430. Unfortunately for them once the neckline at 1340-1345 was broken, that significantly reduced the likelihood of that pattern playing out. It still might of course, since these patterns are not totally foolproof but Thursday’s close at 1335 definitely gave the bears reason to expect more downside in the near future. Friday’s failure to close above 1345 was perhaps another signal of weakness as the bulls could not maintain their gains despite the broadly favourable jobs report. It’s possible of course that the SPX could move over 1345 in the near term. This would not significantly change the dynamic although it would encourage the bulls to make a run at the previous high at 1370. Only a close above 1370 would bring the bulls out in force as the prospect for 1430 would be resurrected anew. The bears will have to try to close the market below 1340 once again, and presumably a lower low below 1330 would seal the deal and turn the tentative trickle into a veritable flood.
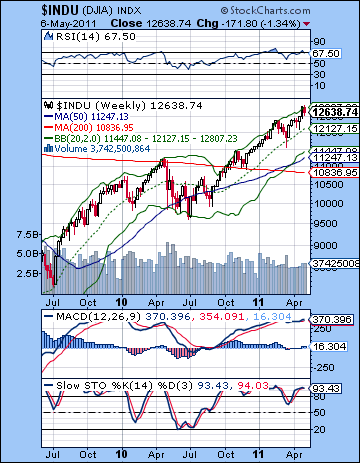
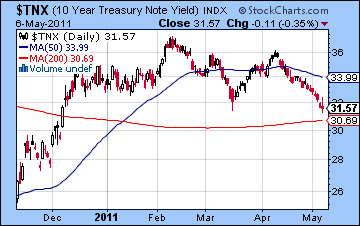
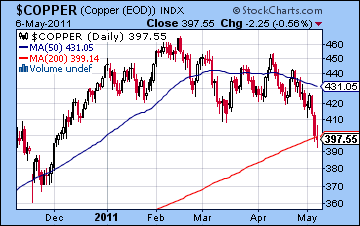
Nonetheless the bulls did manage to hang onto the 20 DMA with Thursday’s close so that is something in their favour. But daily MACD is falling and is now in a bearish crossover while Stochastics (60) appears to be headed lower towards the 20 line. The most critical support level now is the rising channel off the 2010 low which now stands at 1300-1305. A close below 1300 would therefore jeopardize this whole QE2 rally and could see the SPX head towards 1220-1250 in short order. Until we see a close below 1300, however, the market will likely remain a kind of bullish default situation where corrections are generally small. A quick peek at the weekly Dow chart reminds us just how overbought the current market still is. Price is still bumping up against the top Bollinger band and RSI (67) does not really offer much in the way of enticement for bulls with a medium term horizon. Meanwhile, the treasury market continues to point to an economic slowdown and falling equity prices as yields moved lower again last week. 10-year yields have now equaled their March low and appear to be set to test support of the 200 DMA at 3.1%. Longer term support from the rising channel off the 2008 low is around 2.5% so there is a long way yet for yields to fall. A slowing economy is generally bad news for stocks as earnings will get squeezed eventually. Even the currently buoyant earnings may not be as robust as they first appear because they are all predicated on a low US Dollar. Not surprisingly, Dr. Copper again correctly diagnosed the current situation as it broke through support last week and closed near the 200 DMA at 397. While copper could bounce a bit here, its failure to stay above the H&S neckline at 410 increases the possibility of a retracement back to 365 and the rising channel. So both of these intermarket indications suggest that stocks are more likely to move significantly lower in the coming weeks.
 This week could see moves in both directions although I would lean towards a bearish result here due to the Jupiter-Rahu aspect. The early week actually offers a reasonable prospect for gains as Mercury conjoins Venus on Monday and into Tuesday. By Wednesday, these two bullish planets will move into an unusual triple conjunction with Jupiter. While this argues for gains leading up to Wednesday, we must remember that the entire triple conjunction will occur while the influence of Rahu. It is therefore possible that any bullishness could be short circuited and the market could continue to weaken right into the end of the week. I tend to think that the overall result will be bearish, although I still expect some positive days. The most likely candidates for gains may be Monday and perhaps Friday. The planetary pattern is potentially quite powerful so I would not rule out a strong rise that challenged the previous high followed by an abrupt selloff. There is even the chance that we could finish higher on the week, although I would be quite surprised if that happened. A more reasonable bullish scenario would therefore see some kind of rise early on to perhaps 1350-1360 followed by a fairly steep selloff that breaks below 1340. A more bearish scenario would see gains evaporate more quickly and a retest of support at 1300. While such a large decline is quite possible some time in May, I’m not sure we will see it this week. We might, but it is not something would count on. Nonetheless, I do think the probability is for the bearish mood to continue, even if we see a couple of up days along the way.
 Next week (May 16-20) may begin positively on the minor aspect between Sun and Jupiter. But the mood may shift later in the week as Mercury will conjoin Mars by Friday. This is likely to undermine any recovery rally. The following week (May 23-27) looks quite nasty as Venus conjoins Mars will in aspect with Saturn. If that rising channel support at 1300 is still intact by this time, we could well see it broken here. As we move into June, the market is likely to stay bearish as Saturn approaches its retrograde station on June 13. While this in itself is not bearish, it likely will become bearish because of the loose square aspect it forms with Pluto. Admittedly, Jupiter may boost sentiment somewhat starting in June as it aspects Neptune, Uranus and Pluto, but it is possible that it may take a while to shift the mood of the market. For this reason, it is possible that the market may only begin to recover after Saturn has returned to direct motion on June 14. It is difficult to know how low the market might fall here. Perhaps only to 1250. At the same time, there is a genuine chance that it could fall more than that. The Jupiter aspects are likely to lift stocks into July and perhaps into August. August may mark another trend reversal as Saturn comes under the aspect of Ketu. The market looks more bearish than bullish for the period from September to December. October, however, stands out as a more bullish month. At this point, there is a good chance that the SPX will make its lows of the year in December. These could be anywhere from a lowly 800 to a more respectable 1100. We shall see.
5-day outlook — bearish SPX 1300-1330
30-day outlook — bearish SPX 1200-1250
90-day outlook — neutral SPX 1300-1400
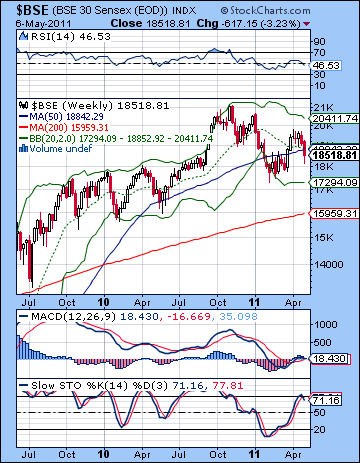
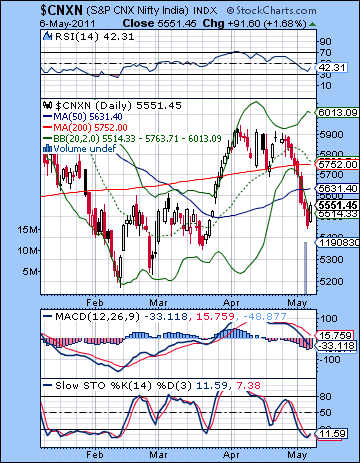 Stocks tumbled last week as Tuesday’s 50-point RBI rate hike highlighted the extent of the inflation risk that confronts the Indian economy. Despite Friday’s reversal higher, the Sensex declined more than 3% closing at 18,518 while the Nifty finished the week at 5551. While I favoured a bearish scenario, the extent of the sell-off was surprising as the early week pessimism from the Mars-Rahu aspect extended all the way into Thursday. This was somewhat longer that I had anticipated as I thought we could see sentiment shift back to positive closer to Wednesday. In any event, the late week period did end on a bullish note as expected. The approaching Mercury-Venus conjunction was enough to shake off the negativity if only for one day as the markets erased the previous day’s losses.
Last week’s performance was a slightly early manifestation of the Jupiter-Rahu aspect which comes exact this week. As I have noted previously, this Jupiter-Rahu aspect is a potentially upsetting influence on the market and has the power to change or least interrupt some fairly basic assumptions about the financial world. Jupiter’s optimism and focus on growth often does not mix well with Rahu’s insatiability and tendency to distort market logic. The result is often unsustainable speculation, or wild gyrations in the marketplace. We have also seen some of these manifestations as gold, silver and oil have fallen sharply off their recent speculative highs. Clearly, speculators are quickly growing weary of some of the negative implications of inflation and tightening money supplies around the world. This rethinking of the downside risk of inflation and speculative excess has hit riskier assets hardest, although it has also produced declines in equities across the world. The recent decline in global markets suggests that the "risk trade" that has accompanied QE2 and the falling US Dollar may not last much longer. The result will be another round of de-leveraging, perhaps not unlike what we saw in 2008. The current Jupiter-Rahu aspect is a potential opportunity for some of this de-leveraging to take place. While it is likely we will see further retracement of these inflated assets over the coming weeks, much of the de-leveraging process may be delayed until the second half of 2011. I had previously suggested that I thought the bulk of the downside from the Jupiter-Rahu aspect would take place after the exact aspect on 7 May. This is still the most probable outcome, although I would note that since stocks have declined somewhat ahead of the aspect, some of the subsequent downside energy may be less impressive. Nonetheless, I still think there is further downside to go as we move through May and into June.
 The bears continue to direct this market as price remains below the 200 DMA at 5752. Since the touch of the falling trend line, the Nifty has retraced towards the 5400 level. The bears have successfully pushed price below the rising trend line off the February low. This rising line (5600) will become important resistance in the event of any rebound rally. There is a larger pattern in play here also that could figure prominently in the future. A triangle pattern has been formed from the falling trend line from the November 2010 high and the rising trend line from the May 2010 low. The Nifty is currently close to testing support from this rising trend line of the triangle around 5350-5400. Bears will therefore try to push the Nifty to try to break support at 5350, while bulls will attempt to first break above the rising trend line at 5600. This closely coincides with the 50 DMA at 5631 so that may level may be doubly important going forward. A close above 5600-5630 would likely see the Nifty rise to 5800 fairly quickly.
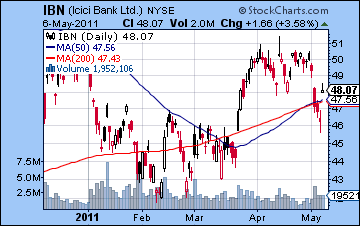
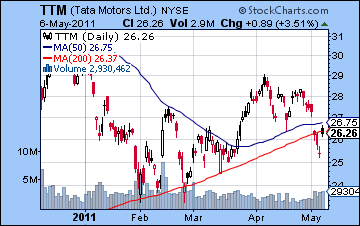
The indicators on the Nifty chart look weak but may be pointing to a short term bounce as RSI (42) may be rebounding after coming close to the 30 level. MACD is still in a bearish crossover and has now turned negative, however, so that is less encouraging for the bulls. Stochastics (11) are oversold and may offer a small boost to the bullish view. The weekly BSE chart also looks bearish as price closed below the 20 and 50 WMA. This effectively negates the recent April rally as the Sensex is back in the same technical position it was in in March. A weekly close above 18,900 would be necessary for the moderately bullish case for this chart. RSI (46) is weak and falling once again, however, so it is possible that the previous lower high is pointing to further downside here. If, however, RSI can stop falling at or above the 40 line, it would create bullish divergence with respect to the previous low. This would increase the likelihood of another leg higher. Stochastics appear to be turning lower again after reaching the overbought area. A close below 18,000 and the rising trend line could be quite bearish for this chart and may hasten a test of the 200 WMA at 15,900. The chart of ICICI Bank (IBN) shows how vulnerable the market is right now as price is testing the 200 and 50 DMA. Friday’s close was higher than 200 DMA so that is quite bullish but the challenge for bulls will be to keep it above this level. Another close below this level could encourage more selling. TTM is somewhat weaker as Friday’s close stopped at the 200 DMA. Another move lower could send this stock down to its February levels. If it should fall below those levels, then it would open up a much deeper correction back to 2009 levels.
 We will see the immediate effects of the Jupiter-Rahu aspect this week. This is an influence that could move the market in a big way. The early week may well tilt positive as Mercury conjoins Venus. On Wednesday, there will be a rare triple conjunction of Mercury, Venus and Jupiter. Since all three planets are considered bullish, there is a reasonable chance for gains leading up to Wednesday. However, the big "if" here is that this triple conjunction will occur while in aspect with unpredictable Rahu. This is likely to undermine the bullishness and could well send stocks lower. Just when this effect will be felt is harder to say with certainty, although I would tend to think declines are more likely from Wednesday and after. That said, it would not surprise me at all if stocks fell in the early week instead. It is a volatile and unpredictable aspect. Overall, there is a probability for a bearish outcome overall. A bullish scenario would see a significant rise Monday and Tuesday to 5800 and then a reversal Wednesday with a close Friday around current levels. A more bearish (and more likely) scenario would see fewer gains and more downside with a possible close below 5500. Of course, if the early week turns out be unexpectedly negative, then we could see those support levels of 5350-5400 tested before a rebound to 5500 by week’s end. I tend to think that is less likely, however, as Jupiter enters Aries on Sunday. Since Jupiter is a bullish planet, that somewhat boosts the likelihood for gains on Monday, at very least.
 Next week (May 16-20) could begin on a positive note as the Sun forms a minor aspect with Jupiter. This could produce one or two days of gains. The mood may darken by midweek, however, as Mercury approaches its conjunction with Mars. Overall, this week could go either way. The following week (May 23-27) looks more solidly bearish as Venus conjoins Mars while in bad aspect with Saturn. This occurs early in the week and could coincide with a sizable decline. It is possible that we could test 5200-5300 by this time if we have not already done so. This looks like it could be the most bearish week of May so a weekly decline of 5% is quite possible. After that, the market looks mostly bearish, although I’m less certain about the extent of the downside. From an astrological perspective, the problem is that Saturn will end its retrograde cycle on 13 June. In so doing, it will form a fairly close tense aspect with Pluto which has the potential to prevent any rallies from occurring. This is important because Jupiter, the planet of rallies, will begin to strengthen in June. At this point, I don’t think it will be able to overpower the Saturn-Pluto influence right away. For that reason, I think we will have to allow for the possibility for a lower low in the first half of June, perhaps right around the Saturn station on the 13th. After that, the odds increase for a recovery as Saturn moves away from Pluto and Jupiter forms aspects with Neptune, Uranus and Pluto. This is likely to take the market higher into July. While this rally may be substantial, it seems unlikely to take the Nifty above key resistance levels (6000 or even 5800). By that time the falling trend line will sit at around 5600 so we will have to see if the Nifty can climb over that resistance level. August will probably see the market move lower again. This bearish move could last into October. It is quite possible that we could see Nifty 4000 tested by December.
5-day outlook — bearish-neutral
30-day outlook — bearish
90-day outlook — bearish-neutral
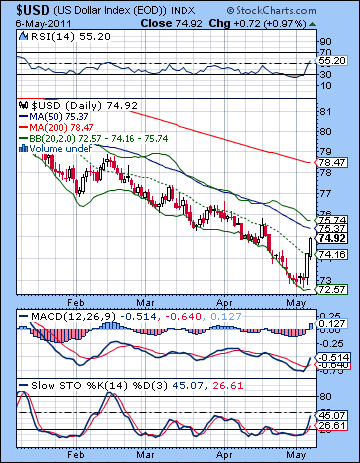 The US Dollar finally flexed its muscles this week not long after Obama did likewise in Abbottabad. Feast or famine, as they say. Amidst all the central bank tightening around the world, the USDX broke sharply higher at the end of the week and closed at the stunningly invigorated level of 74.7. As rumours swirled about Greece possibly leaving the Eurozone, the Euro broke support and ended the week at 1.435. The Rupee similarly weakened to 45.13. Well, it was a long time in coming but it looks like the Dollar has finally turned a corner and the risk trade is fading. I actually thought the Dollar had a somewhat better chance of a gain early on but the fireworks didn’t arrive until later. That was my second window of opportunity. While the specific timing may be unimpressive, it is worth noting that this apparent reversal has taken place very close to the Jupiter-Rahu aspect. I have previously noted that this aspect had the power to change some basic trends in financial markets and last week was further evidence that this was the case. I thought the best chance for a major reversal would occur this week on the triple conjunction of Mercury-Venus-Jupiter but it seems that it has manifested early. It’s still possible that we could see further big moves this week on the triple conjunction but what matters here is that some important resistance levels have been broken. The 20 DMA was decisively cast aside on Friday as the Dollar managed to close right on the falling channel. The Euro looks even weaker as it has already closed below its channel support. The Dollar may now encounter some resistance from the 50 DMA at 75.36 and the upper Bollinger band. Certainly a close above the 50 DMA would be very bullish indeed and could create more explosive upside as investors sell commodity positions and buy up greenbacks. If the risk trade is over and George Soros cashing out of gold and silver is any indication that it is, we can look forward to the Dollar finally righting itself here and reversing this long slide. Again, the ultimate upside target would be 88/1.21, although this may not occur until December or January 2012.
This week looks like there will be more gains for the Dollar as the triple conjunction could well signal a major change in the prevailing financial assumptions. This could truly put the final nail in the coffin of the risk trade as the Dollar again becomes a safe haven. The Euro chart shows a significant level of affliction midweek so it’s possible that Wednesday could be a key day in the unfolding of these events. There is also a chance that nothing too out of ordinary will occur and we will see the Dollar retrace a bit in the early going, followed by another controlled push higher into the late week. That would be the most likely scenario. However, the current planetary setup nonetheless has the potential to produce some big moves so I would not rule out another 1-2% move to the upside for the greenback. Next week looks more mixed for currencies, but the end of the month may once again push more investors into the Dollar. I am expecting the Dollar rally to last at least until mid-June and the Saturn direct station. Just where the Dollar sits at that point is hard to say, although I would not rule out 78-80 which is the 200 DMA. A consolidation lower is likely after that as Jupiter will strengthen and this may rekindle the risk trade once again. The resulting rally in the Euro could last well into August. Then the Dollar will rally again to higher levels and this should last into December or January 2012.
Dollar
5-day outlook — bullish
30-day outlook — bullish
90-day outlook — neutral
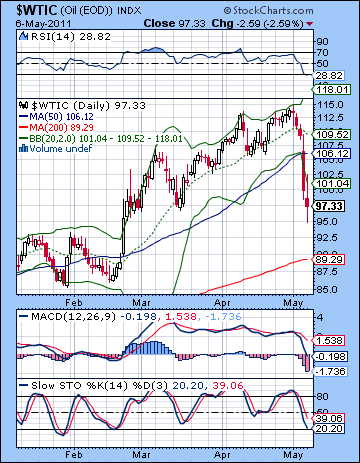 It was the perfect storm for a pullback in crude as the demand outlook soured on bad US economic data, China and India tightened their monetary policies, the US assassinated Osama Bin Laden. The once high-flying commodity risk trade came crashing down to earth last week as crude oil plunged 10% closing below $100 for the first time since March. It was a stunning development to be sure. While I thought the proximity of the Jupiter-Rahu aspect might produce such a move at some point in May (perhaps this week), the correction arrived ahead of schedule. While I could see some negativity at the beginning and end of the week, it was the middle of the week that confounded my forecast. Without any rebound at all, crude simply fell all through the week with the biggest declines occurring very close to the Mars-to-Mars conjunction that I noted last week. From a technical perspective, crude is still in a bullish breakout pattern since it held above the $96 support level. This is the rising trend line of resistance from the previous highs that is now acting as support. The loss of the $100 level was certainly a blow to the bullish case, but as long as the $96 level holds, then the bulls can still maintain they have the momentum. RSI (29) is already in the oversold area which may tempt some investors to go long once again. I would be less inclined to give much credence to this indicator since this market has been surging for some time. MACD is in a bearish crossover and is now threatening to move below the zero line. This would be a bearish development which would herald another leg down. If $96 breaks, then the next level of support is the rising channel off the 2009 low which now stands at $86. This is likely more important as a long term support level and is fairly close to the 200 DMA at $89.
This week is likely to continue the volatility in the oil market, although I’m more inclined to think we will see moves in both directions. The early week Mercury-Venus conjunction occurs in a favourable spot in the Futures chart so this may make gains more likely in the early week. That said, this bullish pairing will be very close to an aspect with Rahu so any gains may not come off as expected. It will be important to keep an open mind here as the astrology could go either way in the early week. Nonetheless, the triple conjunction on Wednesday is perhaps more likely to accompany a decline which could extend into Friday. Overall, I think there is a chance we will see further downside although if the early week is higher, we could see crude climb back above $100 at least temporarily. Next week (May 16-20) could begin positively but crude could weaken again by Friday. The bearish trend will likely stay in place until at least the end of May and perhaps all the way to the Saturn direct station on June 13. This is a very bearish influence for most asset classes and could make rallies unreliable until it has passed. There is a good chance we will see that trend line support tested at $86-90 by the end of May and I would not rule out lower prices still by the middle of June.
5-day outlook — bearish
30-day outlook — bearish
90-day outlook — bearish-neutral
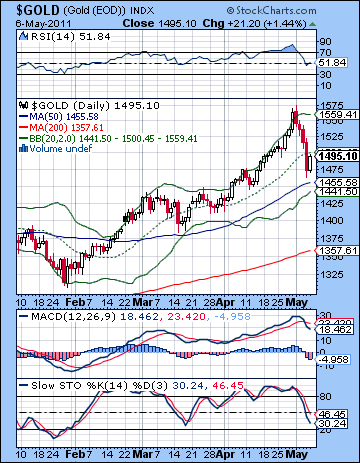 News surfaced this week that George Soros has sold most of his positions in gold and silver. If that wasn’t enough, the CME raised its margin requirements on silver, while the US Dollar rebounded with a vengeance against a backdrop of central bank tightening in Asia. All these factors combined to produce a huge selloff in commodities and precious metals as gold lost 4% to close below $1500 while silver plunged more than 25% to close under $35. It was quite a week. While I noted the increased likelihood of such a major reversal around the Jupiter-Rahu aspect, I thought it would occur this week. In that respect, my timing was off the mark although I thought the chances for a bearish week were fairly good. The technicals are looking for very bearish on gold here as we got a bearish engulfing weekly candle and a close below the 20 DMA. We saw buyers move in near the $1470 support level from the rising channel off the January low. In that sense, the bulls can claim that the game is not yet lost. And in the short term, they may be right. The 50 DMA at $1455 is still intact. If either of those supports should fail, however, it would deepen the gloom around gold and it would hasten a test of the major rising trend line at $1400. A break below this line and gold could fall quite a bit further perhaps back to $1367 and the 200 DMA. But we’re getting ahead of ourselves. The indicators are appropriately weak here as Stochastics (30) is close to being oversold and MACD is in the throes of a bearish crossover.
With the Jupiter-Rahu aspect exact this week there is more opportunity for dramatic moves on gold and silver. The early week period offers a better chance for a rebound on the Mercury-Venus aspect but the presence of Rahu here really makes this outcome quite uncertain. One possible scenario would be gains going into Tuesday and then a reversal midweek on the triple conjunction of Mercury,Venus and Jupiter. The late week period would then be more bearish. This could therefore play out with a recovery to $1520 or so and then a test of $1455 by Friday. The overall direction looks bearish in any event, so it’s really a question of just when all the bearishness becomes manifest. If we don’t see more downside probing this week then next week is another possible candidate, especially towards the end of the week. I expect gold to stay weak until at least the end of May. We could see a reversal as early as May 31 or as late as June 13. I would favour the first date since the Jupiter-Neptune aspect will hit the ascendant in the GLD horoscope. This should help to shore up any prevailing weakness. Gold should rally into July at least. I would not rule out higher highs in the summer although it does not look like a probable scenario. Gold is likely to move lower again in September. This correction will likely extend into January 2012 and will may produce lower lows than anything we might see in May or June.
5-day outlook — bearish
30-day outlook — bearish
90-day outlook — bearish-neutral