

- Stocks in dangerous territory; further steep declines possible near end of the week and into early June
- Dollar to regain momentum towards end of the week
- Gold vulnerable to sharp selling; heading lower still
- Crude oil rallies likely to be truncated; could move much lower into June
Continued fear surrounding the Euro and a grim unemployment report combined to send stocks falling again last week. Volatility remained high with 200 point swings on all five days as the Dow closed down more than 4% at 10,193. After trading as low as 1055 on Friday, the S&P closed at 1087, below its key support level of the 200 day moving average of 1102. While I predicted more downside last week but I didn’t quite expect it would retest the flash crash lows so soon. The level of bearishness of this market has been surprising as the late week gains I thought might accompany the Sun-Venus-Uranus aspects were mostly drowned out by the unrelenting force of the oncoming Saturn station. Only Friday turned out to be higher, and even then it was a predictable technical bounce. That’s a testament to the power of this rare alignment of Saturn, Uranus, Neptune and now Jupiter. This is one of the two pivotal planetary patterns that will shape the markets this year and was a major ingredient in my forecast for a retest of the March 2009 low sometime in 2010. Since the high on April 26 which coincided exactly with the Saturn-Uranus opposition, stocks have fallen by 11%. And while that is well within the confines of a garden variety correction, the entire mentality of the market appears to have changed. Questions are being asked not just about how high European debt levels might impact economic growth, but also about the very viability of the Euro and the Eurozone. More investors are waking up to the fact that the long rally may not have been based on sound fundamentals by rather free government money that merely created another speculative bubble.
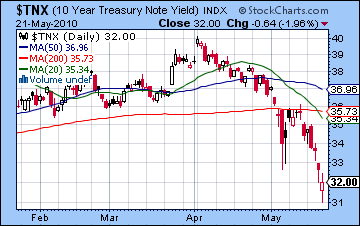
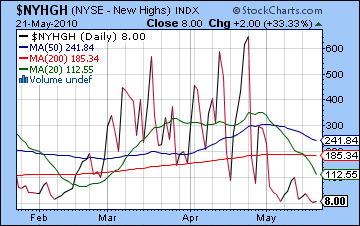
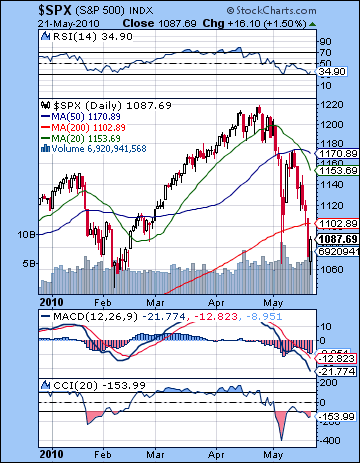 While I always believed we were in a bull rally within a bear market, the failure of the 200 DMA to hold last week may cause more traders to switch sides and go over to the bears. This is a critical level of support for any rally and its violation here is serious. It may still be possible for bulls to argue that as long as the February low of 1044 can hold, the rally can resume anew. That is plausible enough, although other factors would tend to suggest that is more wishful thinking. The February low was still well above the 200 DMA and hence created better conditions for a new leg for the rally. That isn’t the case here as the 200 DMA is now resistance which will likely generate a lot of selling in the event of a rally back to that level. We also see a negative divergence in the daily MACD as it has fallen to a lower level that the previous February low. RSI (34) has made a double bottom here which is potentially bullish but it isn’t well enough defined to call it a bullish divergence. CCI (-153) is still bearish here after a brief run above the -100 line. It actually resembles the pattern of the February correction so in that sense could be seen as a neutral or even bullish indicator. Weekly MACD on the Dow now shows an even greater bearish crossover. Another very negative technical indicator in this decline so far is that volume has continued to rise. This is a classic bearish signal for larger down moves. The $VIX volatility index is back up over 40 and has not fallen below its 50 DMA since the beginning of May. The number of new 52-week highs has fallen and now stands at 8. That is a complete reversal from just three week ago when the number stood at an impressive 647. Treasury yields have plunged as investors have sought out safety with the ten-year closing in on 3%. It is worth nothing that the Fed will be auctioning another $100 billion worth of bonds next week so that reduce money going into stocks and will serve to further depress equities. The current technical set up suggests that we could see another rally attempt early next week. Stocks are stuck on the wrong side of the 200 DMA and bulls will attempt to climb back over, especially as many participants believe that the bottom is in now that the flash crash low has been retested. Friday’s low of 1055 is close enough to the February low of 1044 that bulls may feel content to put in new money. It’s conceivable that we get another test of 1044 on Monday, perhaps at the open, but that is not likely in my view. A rally up to 1100 seems more likely to test resistance at the 200 DMA. Assuming we do not fall too far Monday, I think that is a very likely outcome next week. We may even have enough buying to get to 1120-1130 which saw some resistance last week. But these levels are unlikely to stand up by Friday and will probably spark another round of selling as the bottom is tested once again. Below 1044, there are really no clear support levels. That is one reason for bulls to be concerned since a break below 1044 could spark a huge sell-off or even, dare I say it, a crash. With the planets as negative as they are here and the technical vulnerability of the market below 1044, we do have to consider this to be a possibility. There is a Fibonacci 38 level at 1007 dating from the March lows, with other support possibly around 980. But it’s really no-man’s land down there.
 This week looks like more volatility with a bias towards more declines, especially towards the end of the week. On the positive side of the ledger, Jupiter aspects Saturn this weekend, so that offers some buffering effects from Saturn’s intense pessimism. Thus far, Jupiter has failed to inject much optimism into the equation despite being in fairly close proximity to Uranus. This usually bullish combination has been completely negated by Saturn’s gloomy presence in opposition. It may be that Jupiter may only begin to buoy sentiment after Saturn has reverse direction on May 30. That would begin to ratchet down its energy and allow for Jupiter to better guide market sentiment. But the bears have Saturn on their side this week. It is important to note that Saturn is intensifying its negative energy here because it is approaching its direct station on Sunday May 30. As it slows down ahead of its station, it increases its capacity to do damage, especially when in close aspect with other planets. Mars will be its next conspirator as it moves into aspect with Saturn at the end of this week and early next week. Mars enters Leo on Wednesday, so that could be seen as a negative influence that could truncate any rally attempts Monday and Tuesday. There is a good chance we will see 1100 by Tuesday’s close and 1120 is perhaps more like 50-50. I would not rule out an even higher high for the week but there is a lot of negativity lurking in the background here that is likely to drag on rallies. Tuesday is perhaps the most bullish day of the week with Thursday and Friday being most bearish. It is difficult to guess where we might end up but there is a chance it will be actually be below 1044. I can’t quite bring myself to believe that the selling could once again be that extreme, but it is definitely possible. A more conservative price target might be somewhere between 1044 and 1060.
 Next week (June 1- 4) is complicated by the Memorial Day holiday on Monday. This may make investors more kittish than they otherwise would be the previous Friday and so US markets may have some catching up to do when it re-opens on Tuesday. I believe this catch-up will be on the downside. Mars forms a tight 30 degree aspect with Saturn on Wednesday and then the opposition with Neptune on Friday. These are very bearish influences that ought to take prices down further. The following week (June 7 – 11) Jupiter will form a potentially explosive conjunction with Uranus on Monday June 7 so this may approximate the rebound rally after the lows. I would not rule out fresh lows on the 7th or 8th as Mars aspects Jupiter and Uranus, but investors should prepare for a significant rally here. It could begin on the 3 or 4th, or it might start from the 8th. After that, Monday June 14 looks very bullish as Venus aspects the Jupiter-Uranus combination. The 14th-15th could see a big rise on the order of 5%. So June will likely see a major rally, although the chances of a higher high seem remote now. Last week, I thought the possibility of a higher high in the summer might still be possible, even if unlikely. Now, I can’t see that happening. A head and shoulders pattern is perhaps more likely but that assumes a low near 1044. Since I’m not at all sure that 1044 will hold in the next two weeks, that possibility for a head and shoulders may go by the boards. As a general guesstimate, we could see a 50% retracement rally after lows in early June. For example, if we end up making a low at 1000, then that would mean a June-July high around 1110. Investors who are long should note that the end of June has a difficult Mercury-Ketu and Sun-Ketu conjunctions in quick succession so that is likely to see prices swoon again. The next big configuration, however, will be the Mars-Saturn conjunction on July 30. This is likely to mark a major down day and may initiate another down leg. We may arrive at SPX 666 sooner than we think.
5-day outlook — bearish SPX 1040-1070
30-day outlook — bearish SPX 1050-1100
90-day outlook — bearish SPX 900-1000
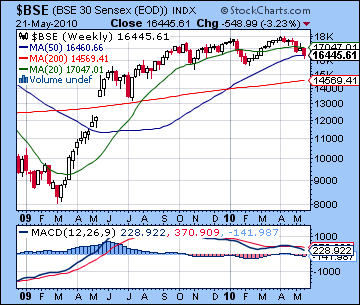
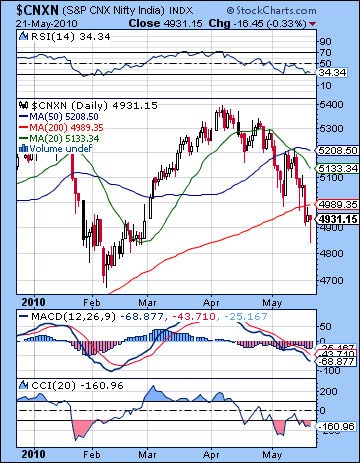 Stocks closed down 3% last week as intensifying global worries over Europe sent investors in search of safe havens. The Sensex was off 3% to close at 16,445 while the Nifty finished at 4931. Despite the fact that Indian equities fared better than most others, it was a bad week as we got three straight closes below the 200 DMA at 4989. I had expected this volatility as well as a retesting of the 200 DMA but I did not quite expect prices to deteriorate this quickly. I thought most of the bearishness would be focused in the early week and while Monday was down, Wednesday turned out to be the back breaker as the Nifty closed below the 200 DMA for the first time since April 2009. I anticipated that once Venus and the Sun cleared away from Saturn sentiment would tend to improve. Alas, both planets were stamped with the overriding negativity from the Saturn-Uranus aspect as its influence grew ahead of Saturn’s direct station on 30 May. At least Thursday and Friday were net positive, although that was more of an afterthought. Last week’s action was scary on a lot of levels. Not only did was the 200 DMA breached, but the Rupee had its worst week in over a year as investors turned risk aversion into high art. Even gold was dumped unceremoniously, as investors around the world hit the panic button and rushed into US denominated assets. The bearishness of the Saturn-Uranus-Neptune alignment is certainly living up to its potential. When I forecast that 2010 would be a down year, this Saturn alignment was one of the key reasons for it. It would likely to take stocks lower although it was unclear exactly when it would hit and how deep the correction might be. As it happened, Indian stocks hit their highs just two weeks ahead of the exact Saturn-Uranus aspect and accelerated their decline immediately after it came exact on 27 April. While the aspect is now separating, it is not losing energy because Saturn will station and reverse its direction on 30 May. This is hugely important since it will represent an expansion of pessimistic energy around the time of its station. Once it completes its retrograde cycle and begins to move forward again, then the chances improve for a return to the rally. That said, I think this rally is mortally wounded and that any sustained uptrend will likely not take us back to the lofty heights of 5400 on the Nifty for a while.
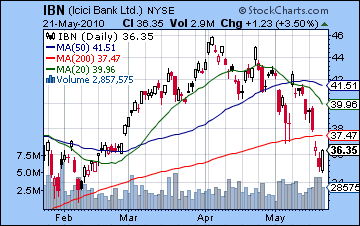
The technical picture has dramatically changed for the worse with the breach of the 200 day moving average. This is a generally agreed upon dividing line between bear and bull markets and its violation last week should make it a lot harder for bulls to sleep at night. It’s not an iron rule of course, but it will increase fear in the market. Rallies may become weaker and sell-offs deeper as a result. But the bulls can still point to the fact that the February low of 4700 is intact. This is a valid point and means that market is simultaneously engaging two opposing views at current levels. Daily MACD is still is a bearish crossover although it remains above the level set in February. CCI (-160) is very bearish but shows a positive divergence with respect to its higher recent low. RSI (34) appears to be bouncing off the 30 level and it also suggests a positive divergence with respect to the previous low. These may indicate that some relief rally may be imminent but beyond that, it is unclear what their implications may be. The bears can point to the fact that volume increased last week to 22,000 on the Sensex. A volume increase with a price decline is a very bearish combination and suggests a growth in fear. ICICI (Symbol: IBN) also fell through its 200 DMA. Note also the rising volume on down days, and the abrupt drop off in volume on Friday’s rise. This is an indication that rallies are not being widely bought. More worrying, however, is that we can see a clustering of the key moving averages taking place in the Nifty chart. I noted this possibility last week, but thought we would be some time away from it yet. The inability of any late week rally meant that the 20 and 50 DMA continued to fall faster towards the 200 DMA. At least the 200 DMA is still rising — that is one feather in the cap for the bulls. But if we get another down week here, then those averages will move even closer and set up a potentially disastrous all or nothing breach where prices fall through all three at the same time. Without clear support, a dangerous slide would not be far off. While I still don’t think we’re at that point, the odds of that doomsday scenario definitely increased in the past week. If the 50 DMA crosses below the 200 DMA, then that would essentially seal the fate of the market and force prices significantly lower.
 This week will see continued volatility with significant price swings in both directions. I believe we will finish lower by Friday. To start the week, Jupiter will be in close opposition aspect to Saturn so that may boost sentiment if only briefly. Actually, this aspect is exact on Sunday so it may be slowly losing steam as we move into Monday. Nonetheless, this aspect should boost prices for at least one day and perhaps two. On Wednesday, Mars enters Leo so that might introduce some new and jittery energy into the mix. I would be cautious near this time since Mars is soon approaching its aspect with Saturn. The end of the week seems more prone to declines as Venus enters its conjunction with Ketu. With Saturn coming to a full stop in the sky on Sunday, it is important to be very careful over the next two weeks since this planet is like a bearish ticking time bomb. I suspect that Mars will set it off in the first week of June, but it may happen sooner, such as this week. If the Nifty is having trouble getting to and staying above 4989, then that is a clue that a large drop may be imminent. It is perhaps more likely that we will be able to climb above the 200 DMA and even close above 5000. But any further closes below 4989 should be treated carefully. My best guess is that we close somewhere below 5000 but above the February low of 4700.
 Next week (May 31-June 4) will start out with Mars joining the Saturn alignment. This is a malefic energy added to an already malefic configuration and should take prices down sharply. Venus conjoins Ketu early in the week also so there is quite a bit of bearish energy here. The end of the week looks more positive although it looks negative overall. The following week (June 7-11) also starts off with a strong Mars influence as the red planet aspects the Jupiter-Uranus conjunction. Jupiter-Uranus is often bullish but it is also sudden and powerful in a more generic sense. The Mars element here opens the door for a possible large move with a greater chance of a down day on Monday or Tuesday. At the same time, we should expect a significant rally to emerge out of this combination of planets around this date. If we do see it drop, it will be brief and likely mark a significant interim low. If it rises, then it will rise sharply. Calling the low in this correction is difficult, although it looks like 4700 would be a conservative estimate. It may well be lower than that, although it is not something I would count on. June generally looks quite bullish so we should expect a 5-10% rise. June 14 and 15 look especially bullish as Venus forms an aspect with the Jupiter-Uranus conjunction. The end of June could see significant bearishness on the Mercury-Ketu and Sun-Ketu conjunctions. Neither of these will last longer than a day or two, but they will occur in close succession so they may create a significant impact and take prices down perhaps 3-5%. We could see the Nifty again above 5000 in June/July but let’s first see how low it goes in its present corrective phase. The next major alignment will occur in late July when Mars conjoins Saturn at 6 Virgo. Neptune (4 Aquarius) and Uranus (6 Pisces) will still be in close range to this malefic duo, so another major down move is very likely. This is likely to last into September and may be even more bearish than the current correction.
5-day outlook — bearish-neutral NIFTY 4700-5000
30-day outlook — bearish NIFTY 4500-4900
90-day outlook — bearish NIFTY 4200-4700
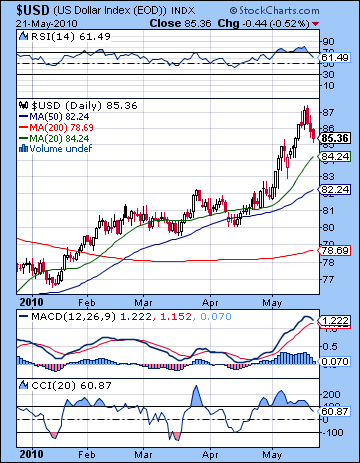 As Euro worries deepened last week, the US Dollar hit new highs for the year above 87. Only intervention from the ECB precipitated a huge short covering rally which eventually pushed the Dollar lower, closing at 85.36. This was very much in keeping with last week’s forecast as I thought we would see early week gains for the Dollar on fear induced by the Sun-Venus-Saturn pattern. I thought we might see an intraweek high Tuesday or Wednesday that is exactly what happened as Wednesday morning was the high for the week. Once the transiting Sun and Venus had moved into Uranus territory, risk appetite improved and the Dollar’s safe haven status became less alluring. Interestingly, I had mistakenly expected this transit to lift equities also, but in the final analysis, only currency markets bore the fruits of this putatively positive risk atmosphere. Of course, it was not a "genuine" boost of risk, since it was stage managed by the ECB and other central banks. It seems that currency intervention may becoming in fashion here. Australia intervened last week after the Aussie got pummeled. There are rumors circulating that the US Federal Reserve may also be preparing to buy Euros if necessary as a way to prevent a dangerous free fall. This intervention talk is a reflection of the increase in volatility we can expect this year as markets will move swiftly and at times counterintuitively. There may also be an uncoupling in the ongoing relationship between equities and currencies. For the past two years, the Dollar and stocks have had a strong inverse relationship. This may be breaking down somewhat as the global currency picture becomes more complicated. Hopefully, some astrological insights will help to anticipate some of these moves. The technical position of the Dollar remains strong as daily and weekly MACD are both in bullish crossovers. Daily MACD is turning down, however, so that may encourage some selling in the short term. RSI (61) has also slumped below the 70 line and looks somewhat bearish. Nevertheless, last week’s negative close merely put prices back into the rising channel originating from the December low. Further corrections down to the 20 DMA at 84 are definitely possible in the short term but that line has been a fairly reliable support level over the past 5 months. After that, the 50 DMA at 82 would be firmer support although that would likely only be tested as support in the event of a very short term move down. Overall, the technicals are bullish.
This week looks mixed as both bullish and bearish trends will likely manifest. I would nonetheless expect the Dollar bulls to prevail here. The early part of the week looks more bearish as the Jupiter-Saturn aspect may correspond with greater risk appetite that would be negative for the Dollar. But conditions may shift Wednesday or Thursday as Mars enters Leo which happens to be the 10th house of status in the USDX horoscope. This is nice placement for Mars as reflects growing dominance and leadership by "King Dollar". The Moon will transit Scorpio, the first house in this chart on Thursday and Friday and so those days look the most positive here. Given Jupiter’s very favourable aspect to that house, it should send the dollar higher, perhaps significantly so. Next week may see more consolidation early but the week after looks bullish again. I would not be surprised to see the Dollar Index hit 90 by that time. The Dollar is likely to remain mostly strong through the summer with weakening likely in November and December. Currency fundamentals may change at that time with a major reorganization of market logics.
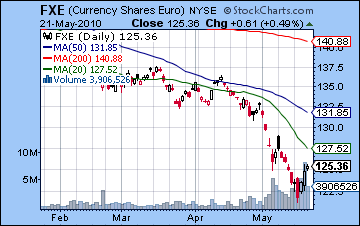 The Euro rebounded strongly on threatened (or actual) ECB intervention closing just under 1.26. This rebound rally fell in line with my forecast as the Sun-Venus combination was well placed in the Euro’s horoscope on Wednesday and reversed much of the previous damage. The Euro fell below 1.22 at one point early in the week when Saturn was still in the driver’s seat. Volume was very high for the late week rebound as the FXE chart shows. This is a bullish indicator that suggests further up moves are possible. Also the daily MACD is beginning to show a bullish crossover, so that is another point for the bullish camp. While it’s conceivable it could continue this short squeeze rally all the way to 1.30, I don’t quite see that happening in the near term. This week could see further upside early on but weakness is more likely later in the week. More downside is very likely over the next two weeks as Mars moves into the Euro’s 12th house of loss. I would expect 1.20 to be tested and likely broken at that time. Meanwhile, the Rupee had a terrible week as it fell sharply closing at 46.8. I had warned that a move to 47 was possible here and that appears to be finally coming true. This week is likely to extend the bearishness although probably not as sharply. We could well see 48 by early June.
Dollar
5-day outlook — bullish
30-day outlook — bullish
90-day outlook — bullish
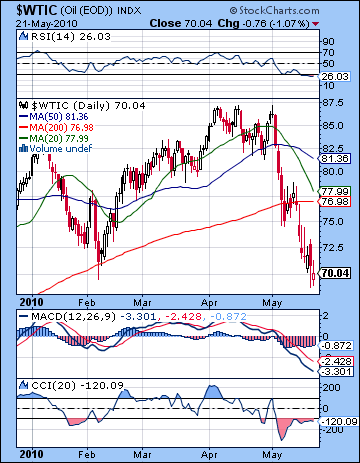 As the flight from commodities accelerated last week, crude suffered the slings and arrows more deeply than most, closing barely above $70 on the continuous contract. While I expected this correction would test the $70 level, I did not think it would get there this fast. The early part of the week was negative as expected with sharp losses below $72. The rebound I forecast for the latter part of the week was underwhelming as only Wednesday was positive which then extended into Thursday morning’s high of $73. It was downhill after that as Saturn took control of the situation and overrode all other comers. It’s hard to find words for the technical picture for crude right now. "Awful" and "bleak" come to mind but they only scratch the surface. After trying to hang on to its 200 DMA around $76, crude plunged sharply. So it is now trading below all three moving averages. They are clustering in an increasingly narrow range and that is another sign that a new major down leg may be in the offing. MACD is in a bearish crossover and shows a negative divergence as it has fallen to new lows with respect to the February low. RSI (26) is oversold but it also marks a new low point in 2010. The only bright spot perhaps is that it managed to hang on to the $70 support level which roughly matches its previous lows. Any closing prices below this level would be even more bearish and likely start a new wave of selling down to $60. Now the 200 DMA at $76 will become more important resistance in the event of any snapback rallies. Any rallies back up to this level will likely be shorted heavily as the chart looks poised to go on an extended bear run.
This week looks mixed for crude with significant gains possible early in the week. That said, Mars sits in aspect to the ascendant in the Futures chart on Monday and that is an untrustworthy source of bullishness. And it is important to recall that Saturn will be stationing near the bottom of this chart on Sunday the 30th, so that fact should override all other considerations. Still, I would incline towards a positive rebound into Wednesday. This could well take prices back towards the 200 DMA. Another test of the $70 support level is very possible by Friday, although I’m agnostic on whether that supports holds up. To be honest, the crude oil horoscope lacks a clear level of affliction that one would expect from another move down right here. Of course, one may not have to look further than Saturn’s tense position in the sky right now. Next week is likely to see another rally attempt, possibly starting on Wednesday the 2nd. But this may only be one or two up days as the chart turns sour again by Friday.
5-day outlook — bearish-neutral
30-day outlook — bearish
90-day outlook — bearish
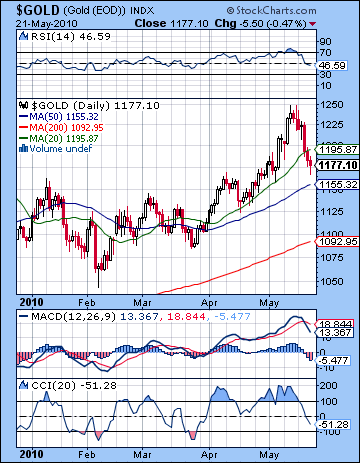 Safe haven? Maybe not anymore. Gold got caught in the crossfire of the Euro panic as investors dumped everything except US Dollars and Treasuries closing at $1177. The gold story has been difficult since its high of $1250 on May 14th. Interestingly, that was the day that Venus entered Gemini. After spending the previous three weeks in the more friendly sign of Taurus, Venus traditionally does not work as well in Gemini and since Venus is one of the key planetary indicators of the gold price (along with the Sun), gold has sputtered ever since. While I predicted some volatility because of this sign change, I did not expect last week to be as bearish as it turned out to be. Mostly that was due to the failure of Wednesday’s Sun and Venus transits to risk-taking Uranus to produce any gains at all. The late week period was bearish as forecast although without the prior boost, gold ended the week worse off. Gold technicals have weakened somewhat, although a correction would be quite understandable given its recent parabolic run. It closed below the 20 DMA at $1195 for the first time in two months and MACD has a bearish crossover. RSI (46) has crossed into negative territory here for the first time in a while so that may give gold bulls more of a sense of caution. Support may lie close to the 50 DMA at $1155. This roughly corresponds to the rising trend line that connect recent lows. If prices fall below that level, the next stop would be the 200 DMA at $1092. This is a little higher than the February lows so between the two of them, gold may be able to find a temporary bottom.
This week could be treacherous for gold. Mars enters Leo on Wednesday so that could well add to the burdens carried by the yellow metal. Leo is a sign ruled by the Sun and hence whatever planet is in Leo will influence sentiment around gold. Mars is not an easy or positive energy in most situations, so this should be seen as a negative influence on prices. Venus is fast approaching its conjunction with Ketu (South Lunar Node) towards the end of the week, and that is also likely to see a "renunciation of wealth", in keeping with Ketu’s anti-materialist agenda. Some gains are still possible in the early part of the week, perhaps, but the direction should generally be down here. Next week also looks difficult as Mars aspects Saturn on Tuesday, June 1st. I am expecting a continuation of this recent correction, probably to the $1100 level by the second week of June. It could well be deeper than that, but let’s see how this week plays out first. Gold may stay below current levels until October and may make a significant move higher after that.
5-day outlook — bearish
30-day outlook — bearish
90-day outlook — bearish-neutral