

Summary for week of May 23 – 27
- Stocks likely to decline this week, early and midweek most vulnerable
- Dollar rally likely to resume; possibly culminating in mid-June
- Crude likely to fall this week; support at $95 may be tested again
- Gold weaker here on Venus affliction, trend line support may be tested
Stocks were slightly lower last week as Eurozone debt worries continued to overshadow other positive developments, not the least of which was the stunning success of the LinkedIn IPO. The Dow was down less than 1% closing at 12,512 while the S&P500 ended the week at 1333. I was exactly wrong in my forecast for early week bullishness on the Sun-Jupiter and Mercury-Venus-Neptune patterns as the market sold off in the early week. This was a head-scratcher to be sure as the short term aspects simply did not pan out. The only explanation that comes to mind is that we are still in the grip of some of that lingering medium term bearish influence from the Jupiter-Rahu aspect. It’s still a close aspect and so it retains a substantial amount of energy. Nonetheless, I thought the short term aspects would be enough to take prices up to resistance and then some. Not so. We did get some of that late-week selling on Friday’s Mercury-Mars conjunction, although it was nothing to write home about.
The market seems to be looking for a direction here as it remains locked in between support and resistance. Stocks are just 3% off their highs but the prospect of another bull run seems fairly unlikely right here. This is perhaps in keeping with the strengthening of Saturn ahead of its direct station on June 13. Saturn is slowing down in the weeks leading up to its reversal in direction and that often corresponds with a rise in caution and declining prices. The added feature of this Saturn station is that it will form a square aspect with Pluto. This is also another potentially bearish influence. Together, Saturn-Pluto symbolizes institutions that have grown too big and too rigid or may be saddled with too much debt. This is very much the case in Europe where further downgrades of Greece highlighted ongoing financial problems. The fundamental flaw of the EU is now increasingly obvious as the one size fits all common currency cannot work where each individual nation issues their own bonds. My guess is that we will see more worries on this front in the weeks ahead as we approach that mid-June period. This is likely to further weaken the Euro and thereby make the risk trade that much more unappealing. This will create continuing pressure on stocks. I still think there is more downside here, although I fully acknowledge that there are scenarios where we could end up going mostly sideways for a while. Since the Jupiter-Rahu aspect in early May highlighted the dangers of inflation, the return of Saturn’s focus on debt and slowing growth may actually be seen in a positive light as the bubble gets sorted out in a more prudent way. In this sense, a stronger Saturn into June could conceivably represent a more balanced approach to global finances. Whether or not the stock market would cheer such a development is another question, and I tend to think that the only solution to a bubble is through lower prices. Nonetheless, I did want to point out that possibility as a reason for hedging or not getting overly enthused about any further correction.
 Happily, my bullish scenario never came to pass last week as the SPX never broke above the falling trend line at 1350. This was good news for bears as Thursday’s high topped out at 1347 or so, just a little shy of the crucial resistance level off the May 2 high of 1370. This means that the bulls could not regain control of the market and we remain very much in a corrective phase. On the other hand, the bulls did manage to defend the 50 DMA at 1325 on Tuesday and therefore prevented the bears from wrestling control of the prevailing trend. So we remain locked in a neutral sort of triangle pattern marked by a series of lower highs and higher lows. The bears can properly claim that they have the edge, however, since the rising trend line support off the March low has been broken and last week’s high was a potential back test of support-turned-resistance line before we head lower. The bears will have to take the SPX below the 50 DMA and Tuesday’s low of 1319 before they can make a convincing case for another leg lower. This would produce a short term lower low and would represent a break out of the triangle. For the bulls’ part, a close above resistance at 1345 would likely increase the odds of another retest of the high of 1370.
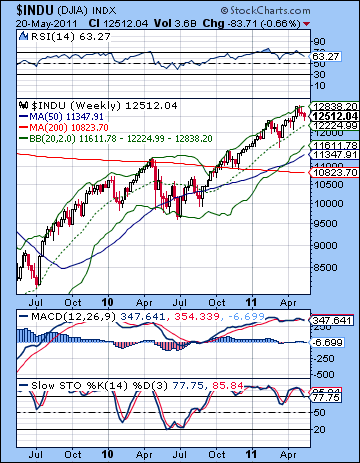
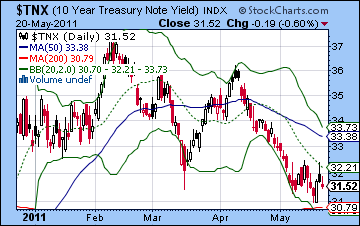
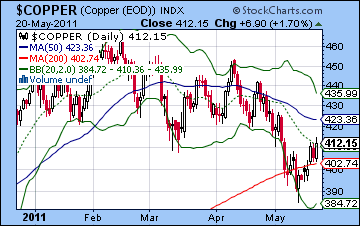
The indicators are looking fairly weak here as RSI is showing lower highs and lower lows over the past couple of weeks. Daily MACD is still in a bearish crossover while Stochastics (41) is heading higher but is not providing clear evidence for either side of the trade. The bullish IHS pattern seems mostly dead here with last week’s violation of the neckline at 1340 and yet there are some bulls out there who still think it is just a particularly messy incarnation of that bullish pattern. Possibly, and yet if the correction enters a new phase as I suspect it might, then it would set up a possible H&S pattern with the February high of 1340 as the left shoulder. If fulfilled, this pattern predicts another low in the vicinity of 1250 before the right shoulder at 1340 would be put in sometime in July or August. It’s certainly a tempting possibility, especially since it would explain the bearishness I am expecting for September. But let’s not get ahead of ourselves. The weekly Dow chart has yet to test the 20 WMA at 12,200 so that somewhat increases the likelihood of lower prices going forward. Stochastics (77) have fallen below the 80 line suggesting a weakening of sentiment. It’s worth noting that a decline to 11,600 which would set up that H&S pattern as it would match the March low would touch the lower Bollinger band. The 2010 correction touched the lower band so it is possible that it may act as support again here. Meanwhile, treasuries held mostly steady with the 10-year yield just below 3.2%. It’s possible that they are testing support here around the 200 DMA, so that could be one reason why the correction in equities is taking some time to play out. A close below the 200 DMA might accelerate a deeper move lower and thereby hasten a deeper correction in stocks. For its part, copper rode the commodities train higher last week closing at 405. This is a potentially significant bullish divergence with stocks and does offer bulls some hope that the correction may be short lived. Note how copper may have temporarily halted a decline below its 200 DMA. If it can climb to its 50 DMA at 423 and break above the falling trend line at 420, then the bulls would have more evidence on their side. Another close below the 200 DMA at 402 would favour the bears, however.
 This week has a good chance of declines as we get another triple conjunction, this time involving Mercury, Venus and Mars. Mercury and Venus are usually pretty bullish planets — last week notwithstanding — but Mars can be more problematic. To make things more tempting for the bears, the conjunction occurs in close aspect with Saturn, the bearish planet par excellence. Monday is the day when there are more exact aspects, although that sometimes does not translate into the biggest moves. Mercury is in aspect with Saturn which is one bearish influence, while Venus conjoins Mars which is a second bearish influence. This makes Monday a slightly more likely candidate for a down day. Actually, the high number of aspects and proximity of these four planets makes this intraweek dynamics harder to read than usual so declines are quite possible on any day this week. That said, Tuesday’s brief Sun-Uranus aspect could bring out the bulls, especially if there is a sell-off on Monday. Wednesday features the closest angle between Mars and Saturn so that somewhat increases the likelihood for a down day then. Thursday is still in the danger zone but the Moon’s conjunction with Uranus in the afternoon may blunt some of the negativity. Friday looks more bearish again as the Moon opposes Saturn. A bullish scenario would see a possible net rise into Tuesday to 1345 and the all-important resistance level followed by declines to 1320 and the 50 DMA by Friday. A more bearish scenario which is more likely would see a sharp sell-off Monday to 1320 followed by a brief rally attempt into Tuesday to 1330 or so and then wider selling after that which tests support at 1320 and which could go all the way to 1300.
 Next week (May 31-June 3) is a shortened trading week after Monday’s Memorial Day holiday. Tuesday’s Sun-Saturn aspect looks bearish so that may represent a negative follow though from the previous week. There is no clear picture after that so we should leave open the possibility of either gains or losses. The following week (Jun 6-10) seems more bullish as Jupiter aspects Neptune. We could see a significant gain here across two or three days. Then Saturn ends its retrograde cycle on June 13 just as the Sun and Mercury conjoin malefic Ketu. It’s quite a nasty set up here that increases the chances for more downside. This could mark an interim low of some importance perhaps to 1250 or lower. Saturn will begin to weaken once it returns to direct motion after this date while bullish Jupiter will gradually strengthen. This will help to boost sentiment. Jupiter will form a very bullish pattern with the Sun and Uranus on Jun 26-28 that is likely to lift prices no matter what the prevailing trend may be. Another alignment of Jupiter with Pluto and Venus on July 8 looks similarly bullish. These Jupiter patterns should be enough to counteract the bearishness from that fading Saturn. The operative word here is "should". I admit there is a possibility that this rally may not unfold as expected, either in terms of timing or in scope. Nonetheless, bulls should be strong enough to start another rally that carries into August. Once Saturn gears up again in its aspect with Ketu in September, the market should tumble, presumably to lower levels. I am still expecting the lows of the year to occur in Q4, probably in November or December.
5-day outlook — bearish SPX 1300-1320
30-day outlook — bearish SPX 1250-1300
90-day outlook — neutral SPX 1300-1350
 Stocks trended lower last week as negative global cues offset some improving corporate earnings outlooks. The Sensex lost about 1% closing at 18,326 while the Nifty finished at 5486. This was very much a surprising outcome as I thought the early week would bring gains which would overshadow any possible downside. As it turned out, Monday’s Sun-Jupiter aspect coincided with declines which set the bearish tone for the market until Wednesday. While the short term aspects looked positive here, sentiment was apparently guided by the ongoing fallout of the slower moving Jupiter-Rahu aspect. This was a missed judgment call on my part, although it was certainly welcome given my overall bearish stance here. The gains only arrived at the end of the week, somewhat paradoxically occurring during an otherwise bearish Mercury-Mars conjunction. This was yet another puzzling short term outcome, although I would note that Friday’s sentiment eventually did turn bearish globally but only after Indian markets had closed.
The market appears to be in a holding pattern here as there is widespread skepticism that inflation and slowing growth will create significant headwinds for profits going forward. To add to the uncertainty, renewed concern over the Eurozone debt problem has meant the international recovery may also not be as smooth as once hoped. Certainly, we saw how excessive speculation was highlighted by the Jupiter-Rahu aspect in late April and early May. This coincided with a correction in risky assets like commodities and, to a lesser extent, in equities as well. If inflation has moved to the back burner, the problem of slowing growth and sovereign debt may be moving to the front burner. This is very much a reflection of the approaching Saturn-Pluto aspect which makes its closest angle on 13 June. This will also coincide with Saturn’s direct station, i.e. it will end its retrograde cycle and briefly become stationary in the sky before resuming its forward motion. As a rule, Saturn increases its negative strength as it slows down near these stations so it increases the likelihood of bearishness and falling prices. It is possible, however, that this increase in Saturn’s influence could actually be welcomed by the market. That’s because Saturn’s pessimism is anti-inflationary by nature. Given the recent inflationary trend, it is conceivable Saturn’s more austere energy might be seen as the necessary solution to the whole QE2 bubble which gets the global economy back on a more even keel. Honestly, I don’t think that is a likely outcome but it is nonetheless possible. The more likely outcome of this approaching Saturn-Pluto aspect is that sovereign debt is seen as an obstacle for growth and investors take more money off the table as a defensive move.
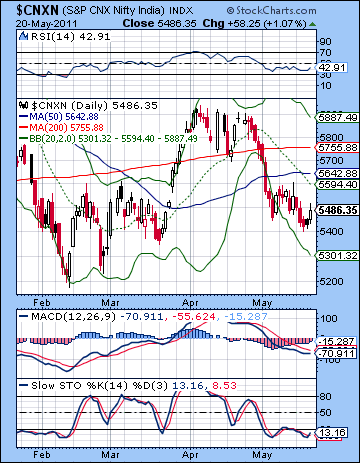
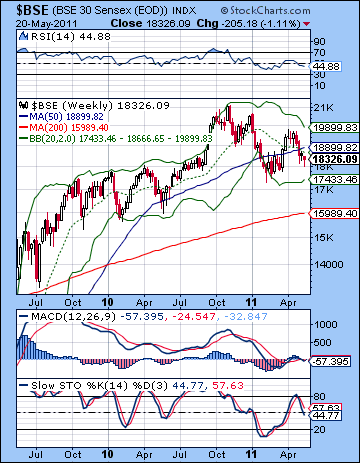 The technical condition of the market looks mixed here. While support held at 5400 last week, the Nifty did make a lower low from the previous week which suggests weakness and a bearish orientation. In addition, to a lower low, the Nifty also made a lower high on Friday. This is a bearish pattern. As if that wasn’t bearish enough, the 20 DMA also closed below the 50 DMA. But the bears do not have complete control either as they could not match the lows from March (5375). Until these lows are taken out, the market may be more range bound between 5400 and perhaps the 50 DMA at 5642. Indeed, we can spot a falling wedge pattern over the past few weeks. This is a bullish pattern where the breakout higher usually results once resistance is broken. Currently, this resistance is close at hand at 5500 or so. Whether or not this bullish actually pattern plays out remains to be seen, however.
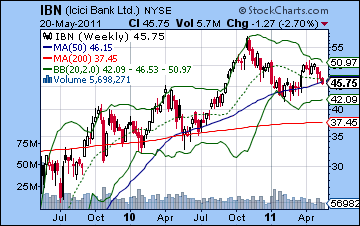
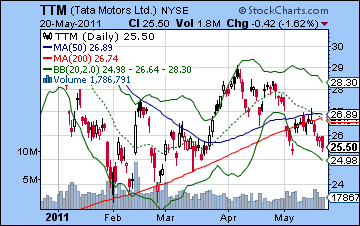
The indicators offer some hope to the bulls that some upside may be forthcoming. MACD is still in a bullish crossover but may be leveling off. RSI is showing a positive divergence with respect to its previous low. This also slightly increases the chances that higher prices are ahead. Stochastics (19) are still oversold and do not present any evidence for further downside, much less taking any new short positions. The weekly BSE chart still shows more potential downside room to the bottom Bollinger band at 17,433. That has acted as support in previous corrections and therefore may become important in the event the current correction has another leg down. Deeper support can be found near the 200 WMA near 15,989. From a medium term perspective, it is important where the low in this correction is made. If the market can reverse here and avoid making a lower low below 17,200, then it would greatly enhance the bulls. But if that February low is taken out, it would increase the probability that the bull market is dead for now since we have already seen a series of lower highs since the top in November 2010. The weekly chart of ICICI Bank (IBN) shows how important current levels are. Previous corrections have taken price down to the 50 WMA on the past two occasions. In each case, it provided support, although in 2009 it resonated with the 200 WMA. If IBN closes significantly below this current level, then it could begin a move down to the 200 WMA at $45, which would be a decline of 18%. Tata Motors (TTM) is in much the same situation. Last week’s decline pulled it further below the 200 DMA. While it remains above February lows, some weak bulls choose to sell if there were any further selling pressure in the near term. As it stands, this chart looks quite bearish.
 This week looks bearish. A triple conjunction of Mercury, Venus and Mars would appear to tilt the market towards the bears given the presence of Mars in this pattern. But this time the conjunction lines up in close aspect with Saturn. So that is an added bearish influence on the overall picture. Monday is the focus of two of these aspects as Mercury forms its exact aspect with Saturn and Venus conjoins Mars. There is a greater chance of larger declines with this alignment of planets, although as always it is important to allow for unexpected outcomes. Tuesday’s Sun-Uranus aspect offers the possibility of some relief so I would not be surprised to see some upward movement around that aspect. Wednesday may tilt bearish since Mars forms its exact aspect to Saturn on that day. Thursday also has a bearish bias as the Moon transits Aquarius in between Neptune and Uranus. Friday could begin positively but the afternoon could have a bearish bias as the Moon approaches its aspect with Saturn. I should say that for all the apparent bearishness here, there is a good chance for one or two up days which could mitigate some of the downward pressure depending on when they occur. The technicals would suggest that any early week move would test the 5400 level once again. There is a chance that it might break lower. A bullish scenario would see support hold, however, perhaps at 5400-5450, with gains into Wednesday perhaps to 5500. Thursday and Friday would then see another erosion back towards 5400. It seems unlikely that the Nifty could finish higher this week, but it is still possible with perhaps only 30% probability of a higher weekly close. A more bearish scenario would see that retest of 5400 Monday with a bounce on Tuesday to 5450-5500 and then lower again but with a breakdown of 5400.
 Next week (May 30-Jun 3) could see gains Monday on a weak Sun-Jupiter aspect but the midweek looks bearish on the Sun-Saturn combination. Some recovery is possible by the end of the week. The following week (Jun 6-10) offers some prospect for gains on the Jupiter-Neptune aspect, although Saturn is there lurking in the background so I’m a little less certain of this bullish influence. If the market has been mostly lower beforehand, then this does look like it could be some kind of rebound. Then Saturn turns direct on 13 June just as Mercury and the Sun conjoin Ketu. This is negative influence that could easily wipe out any gains made in the preceding week. The may be a two or three day sell-off which should be followed by some strengthening of the bulls. The mid-June period could be an interim low in the market, although that could happen in the previous week also. It is quite possible we will retest the February low of 5200 sometime in June and I would not be surprised to see it go lower than that. Gradually, Jupiter will strengthen in June and July while Saturn will weaken. This will likely correspond with a move higher that lasts into August. By the time of the Mars-Saturn square on 25 August, the market will likely peak if it has not already done so. This looks like it will be a lower high than what we have seen in Q1. The Saturn-Ketu aspect in September will likely coincide with another significant correction which will probably characterize Q4. The lows of the year may well come in November and December.
5-day outlook — bearish NIFTY 5350-5450
30-day outlook — bearish NIFTY 5000-5200
90-day outlook — bearish-neutral NIFTY 5200-5400
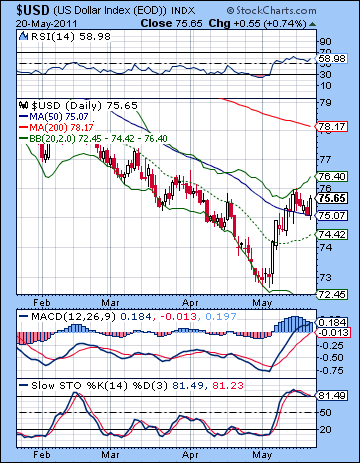 Despite renewed debt worries in Europe, the Dollar slipped last week as positive economic data encouraged the risk trade. The USDX bounced off support at 75 and closed at 75.65 while the Euro ended the week at 1.416 and the Rupee at 45.19. This bearish result was largely in keeping with expectations as I thought we would see some consolidation after the recent rally. The late week gain also arrived on schedule as the Mercury-Mars conjunction created enough fear to scare investors back into safe havens. The Dollar continues to look very strong here as support from the 50 DMA held on Thursday and this propelled the greenback higher on Friday. Monday’s open at the top of the Bollinger band was perhaps a signal for profit taking but now that it has moved off the band, there is more upside room for it to move. The 20 DMA has turned higher and may well cross the 50 DMA next week if the uptrend continues. This would further cement the uptrend. The medium term falling trend line is the next level of resistance at 76-77 and above that the 200 DMA at 78. MACD is still in a bullish crossover and has now crossed the zero line, a very bullish development. Stochastics (81) remain overbought while RSI (58) has moved into the bullish area. Bulls looking to take profits may choose to wait until the RSI hits the 70 line, so that suggests another cent or two rise may be in store. On the weekly chart, the RSI is still at a modest 43. Even if this turns out to be a brief dead cat bounce type of rally, it may well run to 50 before reversing. This is another reason why it could add another cent or two.
This week offers the possibility of further Dollar gains as the Venus-Mars conjunction and the aspect with Saturn seems likely to increase anxiety generally. I would not surprised to see a larger move higher, although I would caution that there is a relative absence of hits in the Euro chart. This doesn’t mean that we won’t see Dollar gains, but it reduces my confidence level somewhat in the overall forecast. So we could see the Dollar index move to that next channel resistance level of 77 which would correspond to about 1.37 in the Euro. It’s unclear if the Euro can fall straight through its 200 DMA at 1.40 however. I would expect some kind of support there, especially that also matches the high from Nov 2010. We could be well on way to a significant Dollar rally here ahead of the Saturn direct station on June 13. This is likely to correspond with a significant low since it will make a very close and negative aspect with the Sun in the Euro’s horoscope. A period of consolidation will likely follow and could last into August. This looks like a major correction and could retrace some if not most of the preceding gains. September will likely mark the beginning of another move higher for the Dollar which will last into early 2012 at least. It is at this time that I’m expecting we could see that target of 88 reached. This would translate into 1.20 on the Euro.
Dollar
5-day outlook — bullish
30-day outlook — bullish
90-day outlook — bearish-neutral
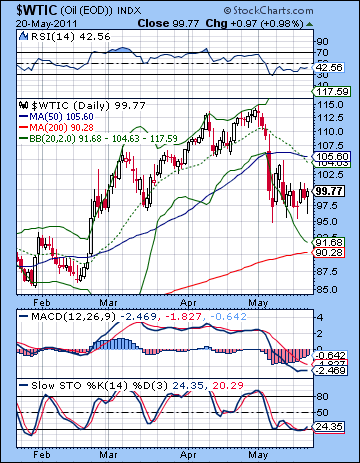 Crude oil edged higher last week as US supply forecasts came in lower than expected. After testing support at $95 early in the week crude finished just under $100 on the continuous contract. As I expected more early week upside, this gain was very underwhelming. As it turned out, the early week Mercury-Venus-Neptune aspect corresponded with declines back to $95 with bulls returning only on Wednesday’s Mercury-Venus-Uranus alignment. The rest of the week was fairly choppy with little headway made in either direction. Crude is increasingly in a narrow range bound trade as it had difficulty holding above the $100 level. Similarly, that rising channel of support is proving to be quite solid indeed as it has been tested no less than four times over the past two weeks. MACD is still in a bearish crossover and is well below the zero line. It is showing signs of flattening out so that may give some encouragement to the bulls that the trend may be changing. Stochastics (24) continue to be close to oversold here as it has a lot of room to rise to the upside. RSI (42) is trying to trend higher. If $100 is broken to the upside, crude may quickly rise to the $105 level and the 50 DMA. Interestingly, crude has fallen back to the 20 WMA on the weekly chart and is about exactly half way to retracing to the bottom Bollinger band which now stands at $82. This is another reason why crude is at an impasse between bulls and bears. There are several support levels that are keeping prices from falling below $95 while few traders are willing to establish significant new long positions above $100.
This week offers a real possibility at a significant decline as the Mercury-Venus-Mars conjunction is in aspect with Saturn. Monday’s Venus-Mars conjunction would seem to be a good candidate for a decline. Tuesday could see a rebound on the Sun-Uranus aspect but Wednesday’s Mars-Saturn aspect could "crowd out" some of that bullish energy and make this generally a bearish week. The Moon transits Pisces on Thursday and Friday so that increases the possibility of a gain on at least one of those days. But while there seems to be a very good chance at a decline this week, it’s another matter whether or not support will be broken at $95. It’s certainly possible given the number and intensity of the aspects involved. And yet, I would not be surprised if that support level held for another week. Commodities markets are closed Monday the 30th, but the down trend may continue into Tuesday and the Sun-Saturn aspect. There could be some bounce for the rest of that week. The first half of June appears to have a bearish bias as Saturn is retrograde and is backing into an aspect with the Sun in the Futures chart. We could see a low between $80-86. Nonetheless, we could see some upside in the week of June 6-10 on the Jupiter-Neptune aspect. Sentiment should gradually improve in late June and July so that crude may again trade over $100. The bears should once again take control of the market in late August and September as the Saturn-Ketu aspect will likely take prices much lower. Q4 looks mostly bearish as crude will likely follow equities lower into December and January.
5-day outlook — bearish
30-day outlook — bearish
90-day outlook — neutral-bullish
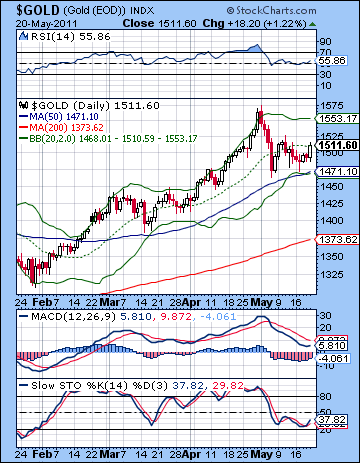 Gold continued to act as a safe haven in a world of unreliable currencies as it climbed to $1511 on the continuous contract. While I mistakenly thought most of the upside would arrive on the early week Sun-Jupiter aspect, we ended up pretty much where I thought we would. Gold has managed to hold up quite well here despite the collapse of silver and the pullback in oil. It really speaks to the strength of the bull market in gold in this new post-recession QE2 world. A couple of months ago, I thought we would have corrected down to the 200 DMA by now ($1373) but that hasn’t happened. It still might, but time is running short by my astro-clock. Friday’s gain was bullish but it did not finish higher than the immediately preceding high of $1518 and in that respect the bulls still have something to prove. A close above $1520 would go a considerable way towards reviving the bull run and might help to take it back to previous highs. The trading range appears to be narrowing and we are in a neutral triangle pattern in the past two weeks. A break out either way will likely begin a significant new trend. If gold does break lower out of this triangle, it will soon encounter the more important rising trend line which now comes in around $1490-1500. If that breaks down, then it could fall to support at $1420 fairly quickly. A convincing close above $1520 would likely see another test of recent highs and in all likelihood, higher highs.
This week has the potential for a decline as Venus is afflicted by Mars and Saturn early in the week. This decline could well be sizable and it is possible we could break below the rising trend line. This could be an important technical development in the gold chart since a break below $1490 or so would increase the likelihood of a longer move lower into mid-June at least. Next week is also likely to remain bearish as Tuesday’s Sun-Saturn aspect may not help sentiment. Then we could see a small rise in early June as both Sun and Venus are relatively unafflicted. The Sun will be approaching its conjunction with Ketu, but that will not become exact until the 14th so there is some room for a rebound before then. In any event, mid-June could correspond with an interim low. Whether gold falls to $1420 remains to be seen. I think it’s possible, but I realize I have been overly bearish on gold. Inflation concerns will likely return for July as Jupiter makes a couple of important aspects. This is likely to bring out the gold bugs once again. Prices may well stay high through much of August before we get another correction. The last quarter of the year should be mostly bearish for gold with lower lows more likely to occur in November and December.
5-day outlook — bearish
30-day outlook — bearish
90-day outlook — neutral-bullish