

Summary for week of May 16 – 20
- Bullish planetary patterns in early week are likely to prevail
- Dollar prone to pullbacks, especially in early week
- Crude likely to rally this week, weakness again by Friday
- Gold may rise although correction is likely to continue into June
Summary for week of May 16 – 20
- Bullish planetary patterns in early week are likely to prevail
- Dollar prone to pullbacks, especially in early week
- Crude likely to rally this week, weakness again by Friday
- Gold may rise although correction is likely to continue into June
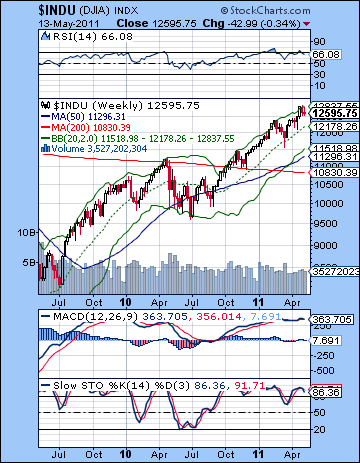
Stocks edged slightly lower last week as fears over Greece and the Eurozone offset improving retail sentiment. The Dow was lower by less than half a percent at 12,595 while the S&P500 finished the week at 1337. All things considered, this week was less eventful than I thought it might be given the volatile potential of the Jupiter-Rahu aspect. The week unfolded broadly in keeping with expectations as most of the strength occurred in the first half of the week ahead of the triple conjunction of Mercury, Venus and Jupiter. I was uncertain if we would break support from the rising trend line at 1330 since there would be likely be a preceding rally that could take the SPX to1360. That’s pretty much exactly where stocks topped out last week on Tuesday and then reversed lower. I thought the subsequent sell-off might have been more abrupt than it was but Thursday’s gain served to cushion the blow on the downside. While Friday’s decline was most welcome, the SPX only fell modestly and tested support once again.
The Jupiter-Rahu aspect is now separating and should be regarded as a diminishing influence on the market. While it has coincided quite closely with a major correction in commodities, stocks have not suffered much damage from the interruption of the risk trade. Perhaps that is a reflection of the fact that less speculative money were in stocks so they were less susceptible to sudden declines under this Jupiter-Rahu aspect. At the same time, it is important to remember that we could see a lag effect from this aspect for another couple of weeks. I would therefore expect that we will see further downside in riskier asset classes for much of May and I believe that stocks will continue to be part of that correction. What may change, however, is that we could see a shift in media focus away from commodities and towards debt and slow growth issues. That’s because Saturn is becoming more powerful ahead of its direct station on June 13. In addition, Saturn will form a square aspect with Pluto around this time and this will likely further highlight Saturn-type issues. If Jupiter-Rahu represents unsustainable speculative excess, the Saturn-Pluto symbolizes crushing debt and slow growth. It is perhaps no surprise that Greece has once again appeared on the radar as a potential problem for the future of the Eurozone. It seems that it will not be able to get its financial house in order as previously agreed. The approaching Saturn-Pluto aspect in June suggests that concerns over European debt levels may continue to haunt the stock market. At minimum, this is likely to put additional pressure on the Euro and boost the Dollar. Once the Dollar re-establishes itself, there will likely be a rebalancing of portfolios out of the risk trade. While nothing is certain, it does suggest a plausible scenario for a further correction in equities. However, I’m not at all sure this corrective phase will extend all the way to mid-June. It is certainly possible given the astrological indicators, but it does seem a little too bearish perhaps. Perhaps a lot will depend on whether crucial support levels at 1330 and then 1300 will hold. If they do not hold, then the chances increase for an extended correction that lasts until mid-June.
 The technical picture of the market looks mixed with a bullish bias. Support was tested not once, but twice as the rising trend line from the March low was approximated in both Wednesday and Friday’s sessions. As long as that support at 1330 remains intact, then the market will essentially have a bullish outlook. A close below 1330 would naturally invite a lot of bears into the fray as it would signal that a move lower to at least 1300 would be a high probability wager. If the bulls can take some comfort in the fact that support held, they did not seriously test previous highs as Tuesday’s rally ended at 1360. This has now created a two-point falling line of resistance that now stands around 1350 that will have to be taken out if there is going to be another move higher. Therefore the market is in a neutral triangle pattern with the next move that breaks the triangle likely determining the next trend — up or down. Temporary fake outs in either direction are still possible.
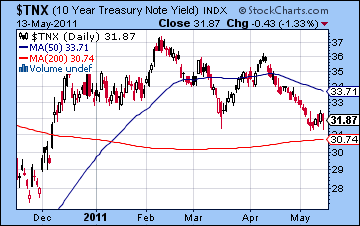
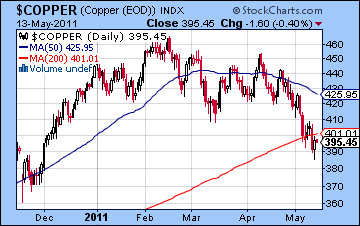
Daily MACD is still in a bearish crossover and falling while Stochastics (33) are falling and have further to go to get to the oversold 20 line. Those are both slightly bearish indicators. We should also note that Friday saw a close below the 20 DMA. Moreover, the day produced a bearish engulfing candle. The weekly Dow chart appears to depict a correction in progress as early May saw the weekly candles bump up against the top Bollinger band line. RSI (66) is still very high, however, so if the correction continues it is likely retrace to a lower level, perhaps somewhere between 40 and 60. The previous correction in February saw the Dow fall to its 20 WMA which would not be equivalent to about 12,200. This is only about 3% below current levels and would mark a very shallow correction. This would equate to about 1300 on the S&P500. A more serious correction would go down closer to the 50 DMA and 11,300. This would equate to about 1210. My reading of the astrological indicators suggests that this second, deeper correction is somewhat more likely, although there is nothing in these technicals that would clearly favor one or the other outcome. However, treasury yields continue to point to lower stock prices as it was a flat week for the 10 year yield as it closed below 3.2%. So the negative divergence with respect to the March low is still in place and offers some evidence that equities may follow suit soon enough. Perhaps even more bearishly, copper continues to look quite weak here as it broke below its 200 DMA last week and could not regain it. This is a more pronounced negative divergence with stocks and indicates that the slowdown in China may be worse than many think. Support in this chart is probably around 365 so we could see more downside in copper before it reverses higher.
 The planets this week offer a probability of some early week upside. Monday in particular seems to be quite bullish due to a Sun-Jupiter aspect and a Mercury-Venus-Neptune alignment. Either of these patterns would usually be enough to induce some gains, but having two simultaneous positive patterns perhaps increases the likelihood of upside. We could easily see the up trend last into Tuesday and Wednesday as the Mercury-Venus pairing aspects Uranus at that time. I would say there is a high probability of a net positive result from Monday to Wednesday, although Wednesday is perhaps somewhat less reliably bullish. But if the early week is higher, then the question is: how high can it go? If the falling trend line resistance is 1350, the SPX is only 1% below that. It seems quite likely that we will break above that level and I would not rule out 1360 by Wednesday. I wonder if we see a double top. But the end of the week looks more bearish as Mercury catches up to Mars by Friday. This will create an alignment with Pluto that may be more negative for sentiment. It’s possible that it will be quite bearish on both Thursday and Friday, although Friday looks worse than Thursday. So a bullish scenario would see a rally to 1360-1370 by Wednesday followed by some profit taking into Friday to 1350. It’s quite possible the week will be positive overall. A more bearish scenario would see a peak to 1350-1360 into Tuesday but more weakness after that with a bigger chance of a negative week overall. I would lean towards the more bullish outcome here since I do not think there is enough downside potential to test the rising trend line this week. It’s possible of course given the difficult medium term influences, but it is not something I would count on.
 Next week (May 23-27) looks more solidly bearish as Venus conjoins Mars while in a bad aspect with Saturn. The beginning of this week looks quite negative indeed and we are more likely to see support break at 1330 here. The week as a whole looks bearish, although the first half of the week may be worse. The following week (May 31-June 3) is also likely to begin bearishly on the Sun-Saturn aspect although we will likely see a rebound in the second half of the week. The next key period is June 13-15 which looks quite negative indeed around the Saturn-Pluto aspect, the Saturn direct station, and the Mercury-Sun-Ketu conjunction. This is arguably the worst looking short term period, with the possible exception of May 23-25. I would think that this mid-June period is worse, however. It looks so bad that it could well represent a significant low. While the preceding week will likely be higher (June 6-10), it is unclear if it will be enough to offset subsequent declines. After mid-June, the odds increase for gains to take hold as Jupiter will strengthen and Saturn should fade into the background. The Jupiter-Uranus aspect looks bullish on June 25, as does the Jupiter-Pluto aspect on July 8. It is quite possible, even likely, that the market will move higher into August. I would not rule out a higher high than 1370. The mood should darken by late August and September looks quite bearish so another significant correction is likely at that time. There is likely going to be a partial recovery from this correction in October. Another leg lower is quite likely in December perhaps testing the 2010 lows of SPX 1010.
5-day outlook — bullish SPX 1340-1350
30-day outlook — bearish SPX 1200-1250
90-day outlook — neutral-bullish SPX 1300-1400
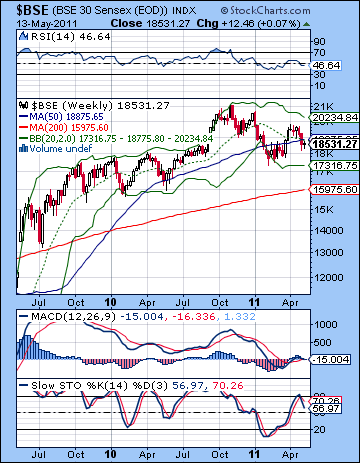
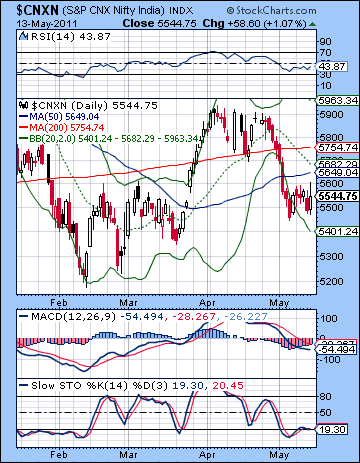 Stocks were mostly unchanged last week as diminished domestic growth prospects were offset by Friday’s market-friendly state election result. The Sensex inched a few points higher closing at 18,531 while the Nifty drifted a handful of points lower finishing at 5544. This was a disappointingly flat result since I thought we would see bigger moves in both directions, especially in the early part of the week. As it turned out, we only saw those gains manifest on commodity markets going into the midweek triple conjunction. Indian equities remained stubbornly flat, perhaps as a reaction to rising oil prices which effectively negated any other prevailing bullishness. The second half of the week was more bearish which was more in keeping with the Jupiter-Rahu aspect. Friday’s gain reduced the downside damage, however, and coincided with a favourable pattern in the BSE horoscope.
Now that the Jupiter-Rahu aspect is separating, the fallout of excessive speculation may gradually be waning. The "risk trade" in commodities and equities is showing signs of unwinding somewhat and this is likely to continue in the weeks ahead. At the same time, it may now be less newsworthy as the initial shock of the change in sentiment is gradually discounted. If I am correct and the risk trade becomes less appealing, then we are likely to see further strengthening in the US Dollar. This is likely to be bearish for Indian equities as investors, especially FII, may seek to rebalance their portfolios. If the Dollar reversal is for real, then all other asset classes are likely to fall. The other key astrological factor I am paying attention to these days is the approaching Saturn-Pluto square that makes its closest contact on 13 June. While this will not be an exact aspect, the power of this combination will be somewhat magnified since Saturn will end its retrograde cycle at that time. I believe the likely effects of this aspect will be bearish for equities. Saturn is usually bearish by nature and often relates to themes of loss or indebtedness. Pluto can be a difficult energy also and is associated with large-scale entities like corporations or nation-states. Together, these planets may indicate a growing focus on issues of debt and recession. We have seen how concerns over Greece’s debt in the Eurozone has come to the surface once again in the past two weeks. This is very much in keeping with the emerging influence of this Saturn-Pluto aspect. I would expect this concern to grow in the coming weeks. If Eurozone debt worries continue to percolate through world markets, then it is likely to weaken the Euro further and boost the Dollar. This would be another negative for Indian equities as it would make the risk trade less attractive.
 Although the market tilted negatively last week, the technical situation is arguably improved after making a higher low from the previous week. Friday morning’s reversal at 5480 continued the trend towards higher lows going back to February and confirms that, at worst, the Nifty is in range bound triangle pattern. Friday’s reversal was also a bullish engulfing candle so that adds to the overall bullishness going into next week. The successful defense of 5500 by the bulls allows for a greater possibility for some upside. Of course, there is considerable room to rise as the Nifty still trades below its 50 and 200 DMA so these may become upside targets at 5650 and 5750, respectively. In addition, we can see that the previous rising support line from the February-March lows now may act as resistance around the 5650 area. Since this is the approximate area of the 50 DMA, this could become an important level of resistance. A close above the 50 DMA and 5650 would therefore be quite bullish.
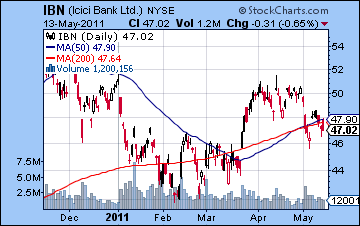
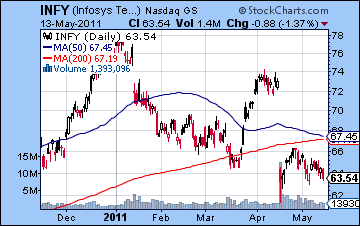
On the other hand, a close below 5450 or so could turn the tables towards the bears in a hurry as this would knock out the previous low and reverse the pattern of higher lows since February. The indicators offer some evidence for another push higher as Stochastics (19) remains overbought and may want to break out higher. MACD is below the zero line and may be leveling out here, and hinting at a reversal. RSI (43) has made a higher low after bottoming out close to the 30 line so that could be interpreted in a bullish fashion. The weekly BSE chart looks somewhat less bullish in the medium term as it remains below the 20 and 50 WMA. RSI (46) is still limping along here while Stochastics (56) appear to be in a down mode. MACD is flat and does not show any discernible trend. While further upside is possible here, the falling trend line off the previous highs will be a big hurdle for the bulls. This currently stands at 19,500 or about 5800 on the Nifty. While a run to that level is still quite possible, the bulls will only have reason to celebrate if it can push the Sensex over that level. Until then, the market looks range bound. We can see how the market appears to be in a holding pattern by looking at individual stocks, such as ICICI Bank (IBN). The early week saw very small gains but these were quickly lost as sellers moved in and pushed prices back under the the 50 and 200 DMA. We can see a similar triangle pattern forming in this chart, with a series of progressively higher lows since February as well as a series of lower highs dating back to late 2010. Infosys (INFY) is still looking quite weak as it may be retesting its recent low. Perhaps it will soon be in a better position to take a second run at resistance at the 50 and 200 DMA.
 The planets this week look mostly bullish at the beginning of the week. Actually, there are two positive-looking patterns on Monday that have a good chance of pushing up prices. The Sun-Jupiter aspect is likely to increase confidence and boost financial stocks in particular. At the same time, there is a Mercury-Venus-Neptune alignment that also seems favourable. The positive effects from these influences may well spill over into Tuesday. Wednesday also could tilt towards the bulls as the Mercury-Venus pairing lines up with Uranus. So there is a good probability of a net positive first half of the week with a good chance of gains on at least two of the first three days. It is quite possible we could see the Nifty rise to 5650 fairly quickly, and there is a reasonable chance that we could break above resistance and test the 200 DMA at 5750. The second half of the week is less obviously bullish with some possible bearish aspects. Mercury conjoins Mars on Friday so that could generally weaken the market, especially if we have seen a sizable gain beforehand. Friday looks more bearish than Thursday, although perhaps not by much. A bullish scenario would see a rise into 5650 on Monday with good follow through on Tuesday and Wednesday to perhaps 5750-5800. A reversal is more likely after that with a possible close Friday somewhere around 5650-5700. This could convert previous resistance (5650) into support and be quite bullish indeed. A more bearish scenario this week would see a gain to 5650-5700 by Tuesday with a possible reversal on Wednesday and then a move back to 5600 or below by Friday. In both scenarios, we close higher than current levels so a bullish week seems quite likely here. I tend to favour the more bullish outcome, especially since there is some technical basis for such a move higher.
 Next week (May 23-27) looks more decidedly bearish as Venus conjoins Mars while in aspect with gloomy Saturn. This pattern could well cast a pall over the whole week although the greatest focus of negativity could be in the first half of the week. The late week period looks somewhat more positive, however, although it is unlikely to compensate for the previous losses. In the most bullish scenario, we could hit 5800 this week and then retrace back down to 5500 by the 25th. That is definitely one possibility although I suspect the downside following the high point may take the Nifty below 5500. The following week (May 30-Jun 3) also looks middling at best with some downside in the early going. This early week low may well test 5400-5450 if we haven’t yet done so. Then a more positive week seems likely from Jun 6-10 with another dip in the week after and the Sun-Mercury-Ketu conjunction. This will coincide with the tightest approach of the Saturn-Pluto aspect so we should expect significant downside here. Whether or not it will be a significantly lower low than 5400 remains to be seen, although I would tend to think it will be a lower low, perhaps even testing the February low of 5200. Around mid-June, the odds for a significant recovery rally improve as the Jupiter-Uranus aspect on 25 June looks quite bullish as does the Jupiter-Pluto aspect on 9 July. The good mood could well last into August and so it is possible that the falling trendline will be tested again. I think there is a good chance it will be broken to the upside sometime in July or August. By late August, sentiment is likely to darken once again as Saturn moves into aspect with Ketu. Generally, the last quarter of 2011 looks bearish so the lows for the year may arrive sometime in December.
5-day outlook — bullish NIFTY 5600-5700
30-day outlook — bearish NIFTY 5000-5400
90-day outlook — neutral-bullish NIFTY 5400-5800
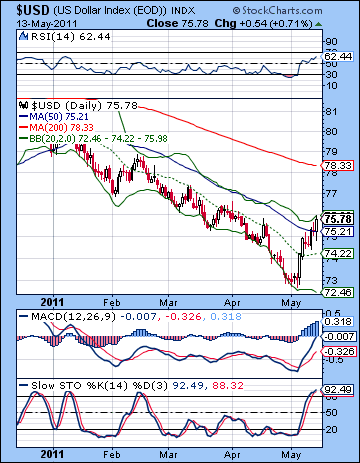 The Dollar looks like it finally has its mojo working again as the rally continued for a second week in the face of growing concerns over Greece debt load and Chinese monetary tightening. The Dollar Index closed at 75.78 while the Euro tumbled to a lowly 1.41. The Rupee held steady in the face of all these gyrations at 45.13. This bullish result for the Dollar was very much in keeping with expectations as I thought we could see more unwinding of the risk trade with the midweek culmination of the triple conjunction. Wednesday brought a big gain and this was followed up by another one on Friday. Friday’s gain coincided with a clear affliction in the Euro chart so that was especially welcome. The Dollar has clearly broken out of its immediate falling channel as it attempts to rally back to the 200 DMA at 78. Actually, the 77-77.5 level matches a long term falling trend line from the mid-2010 high so that may become an obstacle before 78 does. MACD is in a bullish crossover and has reached the zero line. RSI (62) is most of the way back to the 70 line, but still has some upside left before bulls might think about taking some profits. This may well correspond fairly closely with the 77-77.5 resistance level. The weekly chart suggests that the reversal might have legs as MACD is showing a positive divergence while RSI is still quite modest at 44 and can climb to 55 before matching the previous January peak. This should be considered a minimum medium term target for the Dollar. This could represent another two cents at least and would challenge resistance at 77.5. Whether or not it can climb higher than that is really the larger question. It may take a couple of tries before it can.
This week week could be bearish for the Dollar as a lot of the problems of the Euro chart seemed to have passed for now. A retracement back to 75 seems quite likely and I would not be surprised to see it fall lower than that. The end of the week looks more positive for the greenback although I suspect it will be a down week overall. Next week looks more bullish again so we could well see new highs, perhaps over 76. The early week Venus-Mars conjunction is likely to scare more investors back into the Dollar. There is also a strong Saturn transit in the Euro chart that confirms the likelihood of such a move. The Dollar looks mostly bullish until mid-June and the Saturn direct station. This bullish pattern seems more probable due to a clear affliction in the Euro chart. There is a chance, however, that we will see a significant low in the Dollar around May 31, with the possibility of a higher low around June 15. While I tend to think that June 15 will be a lower low, I am uncertain of that. The Dollar should weaken after that since the Jupiter aspects with Uranus and Pluto are likely to boost the Euro through August. This looks like a significant move so we could see the Dollar make another major low in August. Hopefully, it will be a higher low than April. The Dollar should rally strongly in the last quarter of 2011 and there is a reasonable chance that it will reach its target of 88 by early 2012.
Dollar
5-day outlook — bearish
30-day outlook — bullish
90-day outlook — bearish-neutral
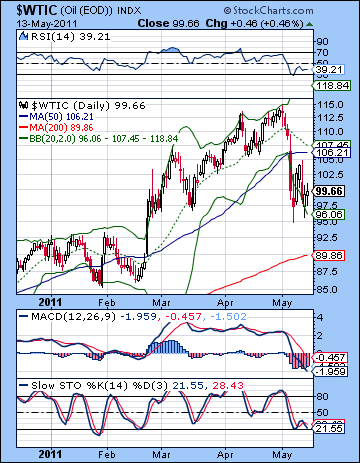 Crude oil recovered a little bit last week as questions over Mideast supply resurfaced. After trading as high as $105 on Wednesday, crude finished just below $100 on the continuous contract. This bullish outcome was not unexpected as I thought we would get some upside from the midweek triple conjunction. Most of the gains occurred Monday and Tuesday and then sentiment became more mixed. Significantly, Thursday’s session again tested support near $96 although Friday’s gain was somewhat surprising. While the bulls can claim a successful defense of a key support level at $96, crude is definitely looking vulnerable to more declines here. It did not even reach the 50 DMA at $106 last week so that suggests that rallies are weaker than bulls would like to see. RSI (39) has bounced off the bottom but one wonders if it will make a second dive down to the oversold level before a proper rally can ensue. MACD is still in a gaping bearish crossover and now well below zero. For the bulls to go anywhere, they will have to push up prices above $105. If they can do that, then they have a chance at a double top. Not exactly a bullish target, but at the moment it’s all they can hope for. More worrisome perhaps is the possibility of a new high at $108 which would form a loose head and shoulders pattern. This would be another bearish pattern that would precede a larger move lower, perhaps back to $80 or thereabouts. Certainly, longer term support is around that $80-86 level so any future downside is likely to find some buyers moving in to defend that support level.
This week looks more bullish for crude as Monday’s Sun-Jupiter aspect is likely to start the week with a gain. It is possible that this may be delayed until Tuesday’s session. Wednesday’s Mercury-Venus-Uranus pattern may also push up prices, although the chances of an intraday reversal lower are somewhat higher at that time. The end of the week looks more bearish again as the Mercury-Mars conjunction may reduce the appeal for commodities. Nonetheless, there is a good chance for a gain on the week. We could easily see $105 by midweek and I would not rule out $108 as a potential high point here. The extent of any late week decline is harder to gauge, although I tend to think it will not be that forceful. So there is a reasonable chance that crude will finish above $100 next week. The follow week looks much more bearish, however. There is a good chance that crude will test support again at $96 and I would not be surprised to see that broken on the downside. While early June could see some upward movement, another significant dip is likely in mid-June. This could well be the key interim low for crude although that could also occur at the end of May. Once Saturn returns to direct motion after June 13, there will be a greater chance for prices to rise once again. This rally should be sustained into July and perhaps August. It is unclear just how strong this rally will be, however. The crude Futures chart is somewhat more mixed that the transit picture, so this would tend to undermine the strength of any summer rally. In any event, August looks like a period when prices will fall again as Saturn strengthens both by transit and in the Futures chart. This correction could be quite significant and will probably last into September. October and early November look bullish, but December looks extremely bearish. I am expecting the lows of the year to occur in December.
5-day outlook — bullish
30-day outlook — bearish
90-day outlook — bearish-neutral
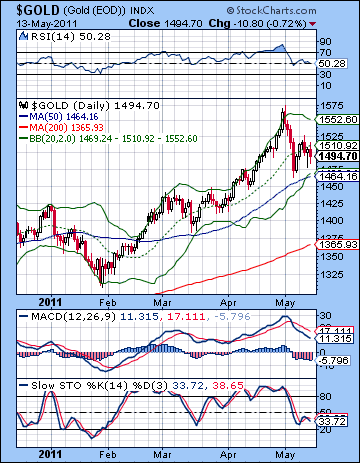 Despite continuing appreciation of the Dollar, gold held its own last week as Eurozone debt woes were seen as a plus for gold as a safe haven. After briefing trading above $1520 on Wednesday, gold closed mostly unchanged at $1494 on the continuous contract. While this result was not unexpected, I thought we would see more late week downside. The early week gains arrived on cue with the $1520 target hit during Wednesday’s reversal session. Gold’s staying power was somewhat surprising as it bounced off $1480 on Thursday and made an even higher low on Friday. While silver continues to be more bearish and volatile here, gold is assuming the role of the more staid half of the precious metals couple. The inability of the bears to break that all-important trend line at $1480 means that this is still the bulls’ market. Gold has tested this trend line twice in the past two weeks but until it breaks, the bulls will stay in charge. If the bulls fail to break above $1520 then that might be on signal that the downside may become more vulnerable. Gold may be having some problems holding on to its 20 DMA at $1510. RSI (50) is in danger of slipping into bearish territory. The March correction turned around near this 50 level before going higher. It is therefore possible that the current retracement may also be arrested before the 50 line is broken. But MACD remains in a bearish crossover while Stochastics (33) are not looking strong. The weekly chart still looks quite overbought and if previous corrections are any indication, a pullback to the 20 WMA would not be out of the question. This currently stands at $1423 and should be seen as a very possible target. There is also a lot of horizontal support at $1420-1440 so that should bring in some buyers in the event that the rising trend line at $1480 is broken.
This week may begin favourably for gold as Monday’s Sun-Jupiter aspect should correspond with gains. There is a reasonable chance that the bullish mood could continue into Wednesday as the Venus-Uranus aspect could also boost prices. It is somewhat unlikely that we will see gains on all three days, although there is a very good chance that we will be net positive during that period. The late week period looks less positive, however, as the Mercury-Mars conjunction may be good for the Dollar and bad for gold. Nonetheless, there is a good chance that gold will finish higher here, perhaps somewhere between $1500 and $1520. More generally, the Sun enters Taurus this week where it will conjoin Ketu for the next four weeks. By itself, this is a bearish influence that may tend to keep rallies short and increase bearish moves. Gold is also represented by Venus and it is conjoined by Mars next Monday, the 23rd. This should be another bearish influence and the decline could be quite significant. There is a real possibility that the rising trend line could be broken at this time. More downside is likely at the end of the month, but a severe drop is also possible around the exact Sun-Ketu conjunction on June 13. Since this occurs on the same day as Saturn changes direction, there is definitely some downside potential in mid-June. This would appear to be the most probable time for a significant low. After Saturn turns direct, Jupiter looks poised to increase in strength. This is likely to boost gold in the second half of June and into July. New highs are possible, although not quite probable.
5-day outlook — bullish
30-day outlook — bearish
90-day outlook — neutral-bullish