

- Stocks moving higher this week with weakness later on
- Dollar may decline significantly
- Gold to move higher
- Crude probably moving higher, perhaps over $81
- Stocks moving higher this week with weakness later on
- Dollar may decline significantly
- Gold to move higher
- Crude probably moving higher, perhaps over $81
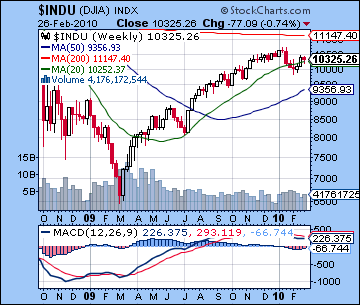
Despite Ben Bernanke’s promise to keep interest rates near zero for the foreseeable future, stocks edged lower last week as more investors began to entertain the possibility of a double dip recession. After trading below 1090 on Thursday, the S&P closed Friday near recent resistance levels of 1104 while the Dow finished at 10,325, down less than 1% for the week. This largely neutral outcome was in keeping with last week’s forecast for a mixed market. I had expected the best days of the week to be Wednesday and Friday and indeed those were the only positive days as Wednesday in particular saw a significant gain. I had also suggested that Monday and Thursday could be difficult. While Thursday did see a significant decline of over 1%, stocks had largely rallied back by the close. Monday was negative as forecast, but Tuesday turned out to be the big down day. Overall, this mixed market offered little support to either bulls or bears as neither camp was able to sustain a move in either direction. Bulls were confronted with more bad real estate and jobs numbers while bears were forced to swallow more of the Fed’s artificially low interest rates and the speculative bubble that they have produced. Some observers are suggesting that the correction is largely over and the market is now entering a seesaw phase. Since I am bearish, I don’t fully endorse this view in the near term, although I do acknowledge that bulls will probably recover their footing once we’ve seen a deeper shakeout.
From a technical perspective, the correction appears to be very much in place since key resistance levels were not broken. Monday saw a test of 1110 (and the 50 DMA) and the market promptly sold off Tuesday. After Wednesday’s recovery, Thursday’s decline tested support at the 20 DMA around 1090. Since both of these levels held, the market seems caught in a narrow trading range. Bulls may take some solace that the rising price channel off the February 5 lows is still a going concern although up volume days are still being overwhelmed by down volume days. The $VIX is now below 20 and may well be heading for a double bottom at 17-18, suggesting the possibility of a little more upside in the near term. Daily MACD is still in a bullish crossover, although it is barely above the zero line. RSI (52) is also slightly bullish. CCI (72) appears to be fading here and offers more support to the bears as it has not managed to hang onto the 100 level. As before, the bears may get more encouragement from the longer term indicators such as weekly MACD on the Dow. This is still in a bearish crossover for the 6th straight week. Current prices are hovering around the 20 WMA and unless they can rise higher, this line (10,200) may become resistance going forward. It is possible we could see the S&P undertake a short rally to test resistance at 1120. While positive, it would not necessarily support a sustainable bullish trend in the market. That would only come if the market somehow manages to break above previous January highs of 1150. I don’t think this scenario is likely in March but it is still possible after the correction has been completed, say perhaps in May. A key support level is around 1080-1090. If this is broken, then it may prompt more selling and we could see a retest of 1040. Since I think we will likely see at least two up days this week, it is possible that we won’t see 1080 broken until next week.
 As worries over the Eurozone have temporarily been pushed aside, concerns about debt levels and inflation are still on the front burner in the bond market. The rate on the 3-month T-bill edged higher to 0.13% Thursday, its highest level since last summer. The 3-month T-bill is very much a bellwether sentiment indicator as higher rates would suggest growing fears of inflation and the likelihood of a rate hike by the Fed. At the other end of the spectrum, the 30-year treasury ($USB) saw its value rise last week, a possible sign of growing risk aversion. Despite recent sales of treasuries by China as a result of geopolitical squabbling, Japan has stepped into the breach and ensured a stable market for US debt. It is worth noting that Japan’s deflationary environment makes US treasuries all the more attractive, even at these comparatively low yields. The horoscope of US treasuries (first traded: Aug 22 1977) shows a period of intense planetary activity in June that roughly corresponds with the Saturn Direct station at 3 degrees of Virgo. This could well correspond with a time when treasuries fall out of favor with investors as a safe haven. There has been a lot of talk recently about the high US government debt levels scaring off potential buyers of treasuries but so far there has been little sign of a reduction in the global appetite for US debt. June and July may represent the first opportunity for a change in that hitherto unshakable faith, however, so we may expect to see yields rise quickly and unexpectedly.
 This week again features some potentially offsetting aspects although there may be reason to expect more upside in the near term. Monday will see the Sun just one degree past its exact conjunction with Jupiter so we could see some residual bullishness emanating from that combination. At the same time, another bullish pairing of Venus and Uranus will be applying to conjunction within just three degrees. For the bears, however, Mercury and Mars will forming a minor aspect on Monday. The Moon will be approaching Saturn that day, also, so it’s conceivable we could end up negative, although that does not seem to be the most likely outcome. Tuesday’s Moon is improved and Venus enters sidereal Pisces, its sign of exaltation, although Mercury will form another minor aspect, this time with gruff Saturn. With the high concentration of aspects here, it’s harder to be sure about their respective time of manifestation. One possible scenario is for a strong open Monday that falters by the close with Tuesday then producing a higher close. Perhaps the safest bet is to see them as potentially offsetting days with an upside bias. Wednesday could be higher as the Venus-Uranus conjunction tightens while Thursday sees Venus form a nice but minor aspect with Neptune. Wednesday seems like the better day of the two and it could well be the best day of the week. Thursday could end up as a reversal day. Friday appears more bearish as Venus moves past the comfort of Uranus and catches sight of Saturn. So even if Mercury running that short gauntlet of Mars and then Saturn, we could well finish higher this week, perhaps testing 1120. Some of these planetary patterns may even be good enough to push prices above this resistance level, although that would require that any down day in the early week is modest in scope. In any event, this week has a good chance of forming an interim high.
Next week (March 8-12) looks more clearly bearish as Venus opposes Saturn on Monday and Mars turns direct on Wednesday. The close proximity of Mars and Pluto to this opposition increases the chances that any declines could be greater than the sum of its parts. It seems likely that we will break support at SPX 1080 here and perhaps even 1040 will be tested. The following week (March 15-19) looks like it begins bullish on the Sun-Mercury-Uranus conjunction but turns negative after Monday or Tuesday. With Mercury now debilitated in Pisces and opposing Saturn, we could see another sizable decline after an early week rally attempt. Perhaps the market will test 1040 here, or even lower. After that, the planets become more mixed for the rest of March and early April. The correction will likely end at some point in late March or early April. April may offer somewhat more bullish prospects that should extend into at least mid-May. This rebound rally should be fairly substantial and could well challenge January highs although much will depend on how low we go in March-April.
5-day outlook — bullish SPX 1110-1130
30-day outlook — bearish SPX 1000-1050
90-day outlook — bearish-neutral SPX 1050-1100
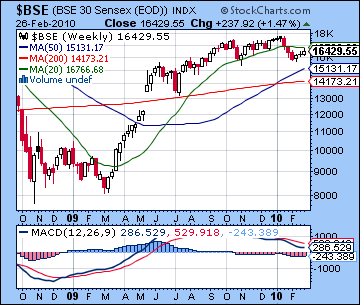
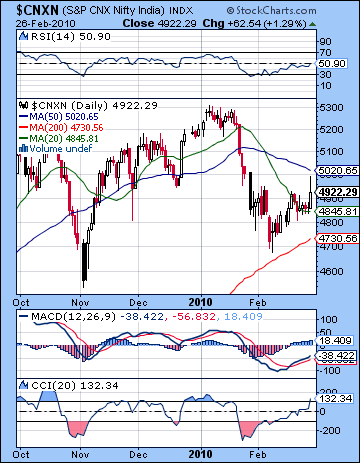 Stocks in Mumbai gained 2% last week as investors were encouraged by the tax relief offered in Friday’s budget. After approaching 5000 midday Friday, the Nifty closed at 4922 while the Sensex finished at 16,429. This bullish outcome was in keeping with last week’s forecast as the Sun-Jupiter conjunction delivered the goods late in the week. I had wondered if Monday might have seen a decline on the minor Saturn influence. As it happened, the market opened higher but then fell through the day and closed flat. Tuesday was modestly higher as expected as the exalted Moon was in aspect with Mercury. Wednesday and Thursday saw stocks trade in a narrow range as the market awaited the budget announcement. All the week’s gains came on the budget reaction as the Sun-Jupiter combination reflected a positive reception for the government’s spending plans. In last week’s newsletter I had suggested that the strong Jupiter influence may incline the government to retain a stimulus footing since Jupiter is associated with generosity. While the government promised to limit the deficit to 5.5% of GDP, they nonetheless set course for a record amount of borrowing over the next year. Significantly, they assumed that a high rate of economic growth (Jupiter) would allow the government (Sun) to expand their debt issuance. But what was good for equities was not seen so favourably by the bond market, as yields spiked higher on Friday. In any event, the lift in prices offered some consolation for the bulls here although the market appears to remain trapped in a correction phase.
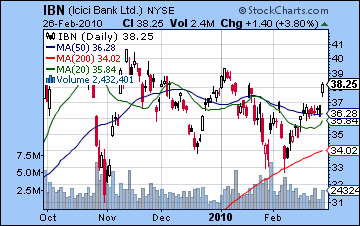
Although technicals are improving, they may not quite paint a picture bulls would like. Daily MACD on the Nifty is still in a bullish crossover, although it remains below the zero line. Prices bounced off support around the 20 DMA last week which showed some bullishness. Nonetheless, both the 20 and 50 DMA are still falling and the Nifty trades below its 50 DMA around 5020. CCI (132) has turned bullish here and may well presage continuing strength. RSI (50) sits on the cusp of bullishness which after its recent journey down to 30 is something of an accomplishment. The Sensex is still trading below its 20 WMA (16,766) and continues to exhibit a negative crossover in the weekly MACD chart for the 17th consecutive week. And Friday’s budget may have lit a fire under the market as can be seen in the chart of ICICI (IBN) but it is still trading below its January highs. The banking sector is a useful overall indicator for the market given the critical importance of credit and lending for the economy going forward. Banks have some difficult technical patterns that do not strongly indicate growth in the medium term. ICICI has a negative MACD crossover in the weekly chart and has a pennant pattern dating back to the October highs. The pennant is a neutral pattern that can be resolved in either direction depending on the ultimate direction of prices. Friday’s gain is a breakout higher above this pattern but it could merely be a head fake to the January highs that goes nowhere. Unless it maintains strength and takes out the November highs of 40-41, one should be skeptical of the banking sector and the market as a whole. We could well see higher prices this week and that would test resistance at the 50 DMA around 5020 and perhaps take the market a little higher than that. One possible target to any rally might be 5150 which would equal the early December highs. This would create a rough head and shoulders pattern which might then lead the market lower. We would take a more bullish stance if the market would rally above 5150 as this would tend to suggest previous January highs were possible. Support could be found in the rising channel that connects the interim lows dating back to August at around 4750. Closes below that level would indicate greater fragility in the near term. If the market takes out the February lows, then it may fall quickly and test 4500 soon.
 This week looks generally bullish although we note some simultaneously bullish and bearish influences occurring early in the week. After Monday’s holiday closing, Tuesday features a potentially negative minor aspect between Mercury and Mars. On the positive side, the Sun will still be quite close to Jupiter so we could see some carry over of Friday’s rally. Also, Venus is approaching Uranus which is another strongly positive influence. One possible scenario here is a negative opening given the Moon’s proximity to Saturn but some recovery through the day. Wednesday could be more generally positive as Venus enters Pisces, its sign of exaltation and inches closer to explosive Uranus. Thursday will see the Moon in Libra under the aspect of Mars at the open so some nervousness is possible then. If the market has moved higher going into Thursday, then it is possible this might be a reversal day. Friday looks more negative as Venus passes Uranus and begins to feel the effects of Saturn’s aspect. I think there is a good chance prices will be higher into Thursday, even if we have one negative day earlier in the week. I would not rule out a run up to 5150 here, especially if Tuesday is positive. If Tuesday is negative, then the market may only get back to 5050. In any event, Thursday may be the last chance to exit the market since the likelihood of a pullback will increase with each passing day.
 Next week (Mar 8-12) looks quite negative with Monday featuring a difficult alignment of Venus with Mars and Saturn. There is a bullish Mercury-Jupiter conjunction near the open but most of the energy from this pairing may evaporate quite quickly. Tuesday also looks bearish as Venus will exactly oppose Saturn. Mars returns to direction motion on Wednesday just as the Sun falls under the aspect of Ketu. This again does not bode well for prices. Some recovery is likely late in the week, especially on Friday. The following week (Mar 15-19) may begin fairly positively as Sun and Mercury will conjoin Uranus. But more losses are likely after midweek as Mercury and the Sun oppose Saturn. The market could well form a bottom at the end of March or the beginning of April as Jupiter comes under the influence of Ketu. April could be a month of consolidation as the bulls regroup and make another rally attempt. This should be strong enough to carry into May. It is difficult to predict how far the market might rally, although a 50% retracement would be a bare minimum. I suspect it will be stronger than that and there is a possibility we could retest highs made in March or perhaps even January.
5-day outlook — bullish NIFTY 5000-5100
30-day outlook — bearish NIFTY 4000-4500
90-day outlook — bearish-neutral NIFTY 4500-5000
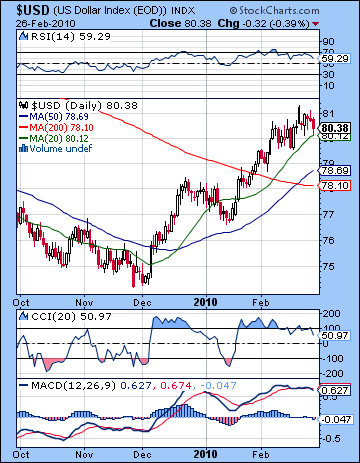 With the Eurozone troubles now off the front pages, the US Dollar slipped last week to close around 80.4. This was very much in keeping with expectations as I correctly noted that weakness would characterize the late week period. The early week was stronger as forecast as Tuesday’s gain took the Dollar back to 81, its critical level of resistance. I had thought we might see more strength Monday but the day ended mostly flat. Sentiment turned bearish Wednesday and continued into Friday although it should be noted that the Dollar managed to close above its 20 DMA. Nonetheless, the technicals worsened last week as we see the beginnings of a bearish crossover in daily MACD. We can also discern a bearish divergence forming in this chart. RSI (59) has fallen from its highs and may well be destined to flirt again with the 50 level as it did in the previous pullback in January. CCI (50) has fallen out of the bullish zone and a quick journey into negative territory seems imminent. While these daily indicators suggest further declines are likely, the longer term technical picture has not substantially changed as MACD is still in a bullish crossover. The Dollar’s inability to hold above 81 has given that level a greater salience so future rallies will have to confront it. Aside from the 20 DMA, the lows of the previous week at 79.5 offer possible support in the event of a pullback. This roughly corresponds with the bottom of the rising channel of the rally that dates back to December. We should also consider the possibility that a correction this week might test the 50 DMA around 78.6.
This week does not augur well for the Dollar. Monday looks bearish on Mercury’s aspect to natal Saturn in the natal USDX chart. We should also note that transiting Mars forms a trine aspect with Saturn over the next week or so and that may also reinforce negative sentiment. While a positive day is possible sometime midweek, the best chance for gains appears to be Thursday and especially Friday. So the Dollar may well fall through Wednesday down below 79 and then stage a recovery above 79 by Friday. Next week looks very bullish as transiting Jupiter should start to build into its conjunction with the natal Moon. Monday the 8th has the potential to be a huge move up. Watch for the Dollar to strengthen until at least Friday March 19 when Jupiter and Venus occupy benefic positions in the natal chart. We should see a close well above 81 then, perhaps to 83. March 25 may be another significant high as Mercury and Jupiter will strengthen the natal chart. It is difficult to say if the high we see on the 25th will be higher than the 19th but it is certainly possible. After that, some correction is likely to begin that could extend well into May. This is likely to be a significant retracement perhaps greater than 50% off recent highs. So if we see a high of 83 in March, the May low might be 76-77 — roughly on par with the January lows. The greenback should rally strongly again after that into June. The summer features a real mix of planetary influences on the USDX chart that is difficult to interpret. A more bearish scenario would be that we may only see a double top formed on a June rally after which the Dollar falls. I will revisit this medium term outlook in future newsletters.
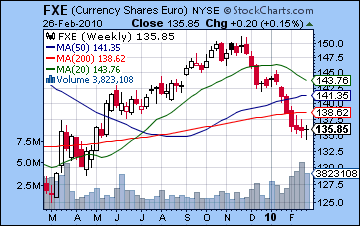 The Euro edged higher above 1.36 last week as concerns over a possible default by Greece and Club Med were put on the back burner. This mildly bullish outcome was largely in line with our forecast as the early week testing of 1.35 came off as expected. As predicted, gains accrued on Thursday and Friday on the return to optimism on the back of the Sun-Jupiter conjunction. Since the 1.35 support level held last week, the technical outlook has brightened somewhat for the Euro. There is a bullish crossover in the daily MACD although prices have yet to break above the 20 DMA. The weekly indicators are still very bearish, however, so it will take more than a week or two of gains to reverse the larger trend. We could see a short squeeze take place here and given the number of hedge funds participating, it has the potential to be violent. 1.38 is very possible in this week, with an outside chance of 1.41. Monday looks like it will be the best day of the week for the Euro with a 1% rise very possible, perhaps more as transiting Venus conjoins natal Jupiter. Wednesday also looks strong as Venus conjoins Uranus. Next week looks quite difficult as Venus opposes Saturn on Monday and Mars stations on Wednesday near the 11th house cusp. We could see the Euro test 1.35 again at that time, with a greater possibility of a break down lower. The Euro should rally more forcefully in April. As investors reacted favourably to the budget, the Rupee strengthened to 46.03. A move below 46 seems very likely here, even if it will be short-lived.
Dollar
5-day outlook — bearish
30-day outlook — bullish
90-day outlook — neutral
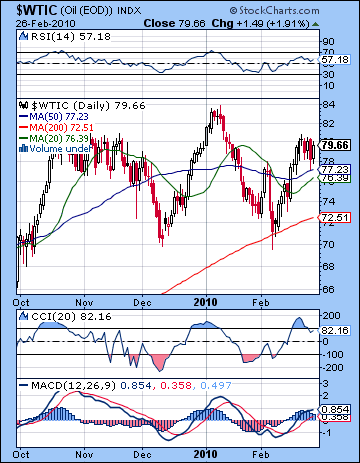 After a fairly choppy week, crude finished slightly lower before closing just under $80 on the continuous contract. We saw some weakness on Tuesday and Thursday as the Sun-Saturn aspect brought out bearish sentiment. As predicted, crude staged a good rally Friday on the Sun-Jupiter conjunction although it was not enough to post a winning week. The short term technicals for crude still look relatively bullish as daily MACD remains in a bullish crossover. RSI (57) is bullish and CCI (82) has slipped below the 100 line and is therefore less supportive of higher prices. Weekly indicators are less bullish, however, so higher prices in the near term will not change the overall bearish picture for crude. The inability for prices to rise above $81 last week should also be seen as a sign of weakness here. If any rally fails to break above $81 here it would reinforce the notion that crude was forming a bearish head and shoulders pattern dating back to the November highs. While the planets this week suggest higher prices are likely, the $81 resistance level will loom large for crude going forward. If it trades above this level, then it may advance to $83 without difficulty. If the rally only goes to $81 and then pulls back, it may foreshadow a deeper correction through March.
This week generally looks bullish for crude as the promise of Wednesday’s Venus-Uranus conjunction should outweigh fallout from the minor aspects that afflict Mercury. Monday’s open should be quite strong as the Moon will oppose Venus-Uranus and thereby form very supportive angles with the ascendant in the natal chart. Tuesday is harder to call although a down day is more possible here. Wednesday again seems positive with the Moon in a harmonious aspect with Venus-Uranus at the open. The late week period looks less conducive to gains with Friday looking more negative of the two days. It seems likely that $81 will be tested here and I would not rule out a run up to $83 by Wednesday’s close or Thursday’s open. Look for crude to fall sharply next week, however. We could see $70 tested fairly soon, perhaps during the week of March 15-19. While March looks bearish for crude, it’s possible that prices will hold up favourably compared with equities or gold. After a rally in April and May, a steeper decline is likely in June and July.
5-day outlook — bullish
30-day outlook — bearish
90-day outlook — bearish-neutral
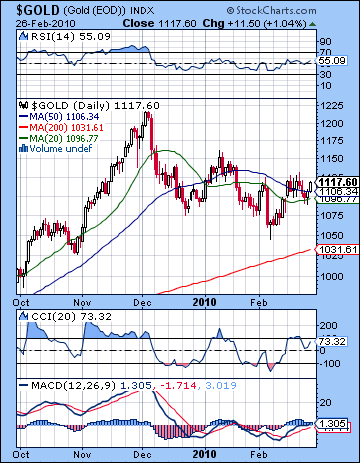 Gold was mostly unchanged last week as it closed Friday at $1117 on the continuous futures contract. Last week’s forecast of early week declines was largely correct as priced dipped below $1100 by Wednesday. This was in part due to the minor Saturn affliction to the Sun which peaked Monday and Tuesday. But Friday’s Sun-Jupiter conjunction came through as advertised and took prices higher again. The short term technical outlook for gold looks fairly positive. Daily MACD is still in a bullish crossover and has managed to cross above the zero line. RSI (55) is bullish and CCI (73) did not fall below the zero line last week. It may therefore have a better chance to travel back above the 100 line in the near term. Last week’s pullback also managed to stay above the 20 DMA, a possible support level, and prices were sufficiently bullish to close above the 50 DMA at $1106. Coincidentally, $1106 is also the 20 WMA so that may increase the significance of that level in terms of future support and resistance. While short term indicators may be positive, the medium term still seems bearish as we still see a negative crossover in MACD. Also volume in the GLD ETF remains unremarkable over the course of the rally that began February 5 which is another sign that prices may not be able to equal December highs. If gold should rally, the next level of resistance would be around $1150. Since the planetary indications are more or less favourable this week, such a run up is possible.
This week looks fairly bullish as the Venus-Uranus conjunction on Wednesday should be enough to offset the negativity from the Mercury-Mars-Saturn alignment. Monday is likely to be fairly strong as the Moon aspects Venus. Tuesday is more uncertain as Mercury is in tense aspect with Saturn. At the same time, Venus enters Pisces and will build into an aspect with the natal Sun (2 Scorpio). It’s therefore possible we could see a decline Tuesday but Wednesday is likely to more than make up for any pullback. Changes may be afoot by Thursday as Venus slips by Uranus and has to deal with Saturn’s aspect. Friday could go either way, although caution should be exercised if gold has moved higher beforehand. Gold seems likely to weaken next week, perhaps significantly. We should retest the February lows of $1050 at some point in March. I would not rule out a break below $1000 over the next month although that is not certain. Even with some rebound in April and May the medium term trend in gold may stay neutral to bearish until June when we will likely see another rally. While significant, it will likely pale in comparison to the rally expected for the fall of 2010. October and November looks extremely bullish and we could see a gold make major new highs at that time.
5-day outlook — bullish
30-day outlook — bearish
90-day outlook — bearish-neutral