

Summary for week of June 13 – 17
- Stocks vulnerable to declines on lunar eclipse, possible late week rebound
- Large currency moves possible; Dollar could strengthen further
- Crude could be volatile around midweek eclipse; decline likely
- Gold support at $1520 in jeopardy this week
Summary for week of June 13 – 17
- Stocks vulnerable to declines on lunar eclipse, possible late week rebound
- Large currency moves possible; Dollar could strengthen further
- Crude could be volatile around midweek eclipse; decline likely
- Gold support at $1520 in jeopardy this week
Stocks entered full-blown correction mode last week as Ben Bernanke offered no quick liquidity fixes for investors praying for QE3. The Dow lost more than 2% closing at 11,951 while the S&P500 finished the week at 1270. The extent of the bearishness was surprising as I did not fully expect that we could decisively break support at 1300 from that rising trend line until next week. I thought the Jupiter aspects with Venus and Neptune in the second half of the week would be enough to offset any early week declines. But we only got one up day on Thursday on that nice Jupiter aspect but it was not enough to erase the losses from the early week Mercury-Saturn aspect. I did think there was a good chance that we would go lower in the first half of the week but I thought that 1290 would hold before reversing back to 1300 and above. Instead we saw Wednesday close near 1280 which did not generate much of a bounce at all since it had violated support. This soured the market mood and reduced the chances of an immediate rebound. I had been more skeptical about Friday, however, and thought that we could be susceptible to declines on the Mars-Rahu aspect. Friday was sharply lower as stocks suffered their greatest loss on the week.
The market is starting to resemble a sinking ship here as the Fed has signaled that it won’t be topping up the QE2 punch bowl anytime soon. All of a sudden, the future does not look too rosy for long term bullish investors. With government liquidity now sidelined for a while, the market will have to fend for itself. That means the private sector of the economy will have to generate its own growth without a helping hand from Uncle Sam. This all sounds like a very Saturnian scenario and very much in keeping with expectations for declining stocks at least until this week. Saturn is the prevailing planetary energy right now because it is moving very slowly ahead of its direct station on June 12. As Saturn ends its retrograde cycle and reverses direction it is often correlated with corrections and market bottoms. As I have noted previously, this particular Saturn station is perhaps more reliably bearish because of the square aspect it forms with Pluto this week. Saturn-Pluto can be quite pessimistic and tends to put the emphasis on losses, debts, and recession. The bearish cherry on top is that we’re in the middle of an eclipse period from June 1 to July 1 so that is another factor that tends to increase volatility. It’s clearly quite a precarious time for financial markets right now. While there is still the prospect of some bullish Jupiter aspects in the coming weeks, a higher high this summer is looking more unlikely. That May 2 high of 1370 (Dow 12,876) may therefore be the best the market can do for this year. But let’s first see what kind of lows we get in June.
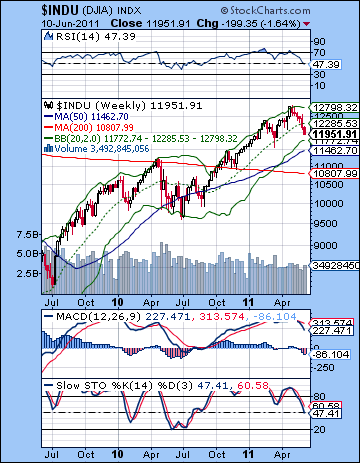 The bears are fully in control of the market here as the rising trend line off the March 2009 low was decisively broken last week. Thursday saw a failed rally attempt back to this line at 1300, but it fell short, stopping at 1295. This was a very bearish development. At the same time, it’s important to recognize that this is the logged trend line. While this is likely more telling technically, there are still many investors who use a linear chart and their trend line support at 1250 has yet to be broken. 1250 is becoming a well-advertised potential bottom for this market as there are a number of intersecting technical factors that will likely bring in more buyers at that level. The March 16 low was 1249 and the 200 DMA is 1253. Throw the linear trend line support in there and you have a neon-flashing support level. But is this too obvious? If too many investors are looking for a decline next week to 1250 before they buy, could this expectation be confounded? The short answer is yes — the market often upsets expectations. Given the current oversold levels on the market, it would be tempting to think that the reversal higher could occur before the SPX gets down to 1250. RSI (32) is close to its March low while Stochastics (7) are scraping along the bottom. MACD is moving deep into negative territory.
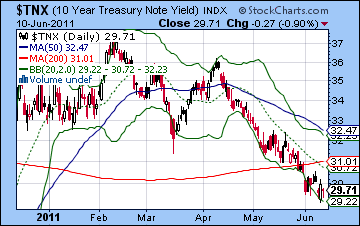
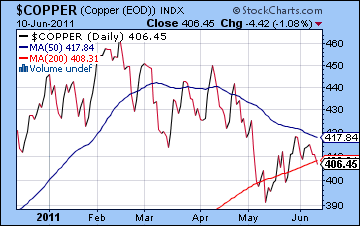
The rising trend line will likely continue to serve as major resistance in the event of any rebound rallies both this week and through the summer. Even if 1300 is not tested this week, it is possible that the SPX could back test the trend line at some later date, perhaps as moving as high as 1350 into July and August. This would of course set up quite an impressive head and shoulders pattern which would then set the stage for the larger late summer sell-off that I am expecting. But that assumes that the market stops its correction quite soon, and does not do a bungy jump during this eclipse period that plumbs the depths at 1220 or lower. The weekly Dow chart seems to offer further evidence that we could bounce off support sooner rather than later. Last year’s correction stopped at the bottom Bollinger band and this one might also, coming in now at 11,772. That is a close equivalent to SPX 1250 and should add to support at that level. Stochastics and RSI are nowhere near oversold, however, so there is definitely more downside if those support levels do not hold. As the stock sell-off deepened, bonds rose as 10-year yields again slipped under 3.0%. Yields still have a ways to go before they hit trend line support at 2.5% so there is more likely more downside possible, either in the coming days or more likely over the next few months. As an indicator of future economic activity, copper lost some ground last week as it fell alongside equities. Despite the decline, it is managing to hold onto its 200 DMA. However, since it has failed to recapture its neckline from the head and shoulders, it should be regarded with caution. A close below the 200 DMA this week would be quite bearish and would be another clue that equities could fall further in the near term.
 This week could be quite interesting as we will see the effects of the June 12 Saturn station along with Wednesday’s lunar eclipse. Monday begins with a Mercury-Mars-Ketu alignment that should increase the odds of a decline. Mercury is actually conjunct Ketu on Monday so it is possible we could actually see as rebound up day. I am generally bearish for this week but I would not rule out some sudden short-covering rallies. Monday is a more likely rally day in that respect. On Tuesday, Mercury is in a tense aspect with Mars while the Sun takes it turn to conjoin Ketu. This also looks bearish and it is possible the downside could be large. The lunar eclipse occurs Wednesday afternoon before the close of trading so that also increase the chances of volatility. Thursday is more mixed as Venus forms a difficult aspect with Saturn while Mercury is in a more helpful aspect with Neptune and Jupiter. The positive Mercury influence looks stronger for Friday so it’s possible we could see a low on Thursday with a reversal that continues into Friday. Overall, there is a real chance of more downside this week. Given the destabilizing nature of eclipses, I would say that a large decline is also possible that breaks below 1250. And yet if Monday turns out to be higher, we may end up testing 1250 at some point. It seems too obvious somehow, and yet that is perhaps a safer working assumption. Of course, it’s conceivable that we could rally at the end of the week and end up positive above 1270. This seems too optimistic given the intensity of the current planetary alignment. These planets look powerful and they have the potential to reverse the trend from negative to positive, or alternatively amplify the trend to a new level of negativity that surprises most observers. It should be an noteworthy week for sure.
 Next week (June 20-24) may well begin on a negative note as Mars squares Neptune. Tuesday also looks bad as Mercury squares Saturn. So it is possible we could have a continuation of the down trend into this week, assuming that June 13-17 is lower. It’s worth noting that there is an FOMC meeting scheduled for Tuesday and Wednesday so the market may not respond well at least at the outset. The Sun-Jupiter aspect towards the end of the week may improve sentiment. It’s hard to say exactly when it will manifest owing to an extended contact with bearish Mars through midweek. The safest bet would seem to be a rise Friday with a somewhat lower probability on Thursday of a gain. In the larger picture, that means we could actually see an important interim low made Jun 20-24 rather than Jun 13-17. I will admit I am uncertain about this, although I would tend to favour June 13-17 as marking the low point if only because it is astrologically tidier. The following week (Jun 27- Jul 1) should begin very bullishly (+2%?) as Jupiter is in close aspect with Uranus. This optimism should be enough to produce a winning week although I am somewhat concerned about the Sun-Moon-Saturn alignment on Friday, July 1. This is a very bearish set up. The bulls should reassert themselves by July and the Jupiter-Pluto aspect on July 8. I am still expecting a rally in July and August as Jupiter appears to strengthen while Saturn weakens. The most likely unfolding of this Jupiter energy should be a substantial rally, perhaps on the order of a 10% rise. Then September looks quite bearish indeed, as does December-January. I would expect the year’s lows to occur sometime in Q4, probably in December. Just how low we go is hard to say. If the past two years has surprised me on the upside, then I’m fully prepared to be surprised on the downside. The 2010 lows of SPX 1010 will likely be in play by the end of the year.
5-day outlook — bearish SPX 1240-1260
30-day outlook — bearish-neutral SPX 1250-1290
90-day outlook — bearish-neutral SPX 1200-1300
 Stocks edged lower last week as declining industrial production and global cues undermined all rally attempts. The Sensex declined less than 1% closing at 18,268 while the Nifty finished the week at 5485. This bearish outcome was surprising given the apparent strength of the Jupiter aspects with Venus and Neptune. Moreover, the modest gains we did see occurred in the first half of the week rather than the second, as I had expected. The effect of the Jupiter aspects therefore manifested a little early before the aspects had become exact. In last week’s newsletter, I had wondered how reliable these bullish short term aspects might be given the more bearish medium term influence of Saturn. The fact that the Nifty could not even test resistance at 5600 was proof that Saturn continues to dominate sentiment. Even with the sideways range bound trading we have seen lately, the glass is still looking half empty here.
While the market remains range bound lately, there has been a distinctly bearish bias as investors are starting to absorb the new reality revealed by Fed Chair Bernanke last week. There will be no QE3 once QE2 has ended on June 30 so the markets will have to sink or swim on their own. This could be a bitter pill for emerging markets like India which have benefited from the Fed’s liquidity and the fast money inflows over the past two years. The removal of US stimulus has made more investors aware of the genuine risks to the recovery as recent data suggests slowing growth. This new bearishness is all in keeping with the strengthening of Saturn we have been tracking in past weeks. Saturn tends to increase its bearish influence around the time that it changes direction in the sky. Saturn is currently near the end of its retrograde cycle as it prepares to return to normal forward motion. Once it begins to speed up, it will lose some of its power and will gradually be offset by Jupiter. This should eventually stabilize markets, although probably not before additional damage is done. But stabilization is not the same as a new bull market. I don’t think there’s much chance that stocks can begin a major new rally this year. There are simply too many sources of economic uncertainty. All that Jupiter-Uranus energy over the past year focused our attention on growth that was unsustainable and ultimately inflationary. With Jupiter no longer aligned with Uranus, inflation will tend to become less of a worry. Instead, investors will tend to shift their focus towards more Saturnian matters like debt, recession and falling living standards. In other words, it seems much more likely that we will move into a new phase of de-leveraging in the coming 12-24 months. The ongoing square aspect between Pluto and Uranus during that time indicate that there could be major changes in the global financial regime, as currencies and organizations such as the IMF undergo significant revision. While some of these changes will likely be positive in the long run, they could prove to be problematic for markets in the short run.
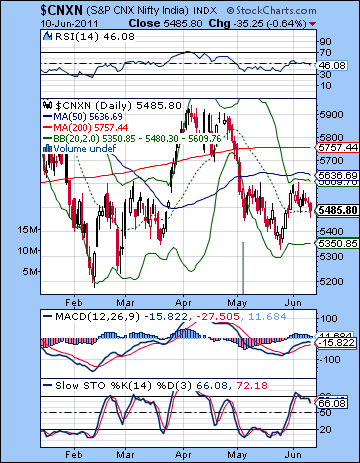
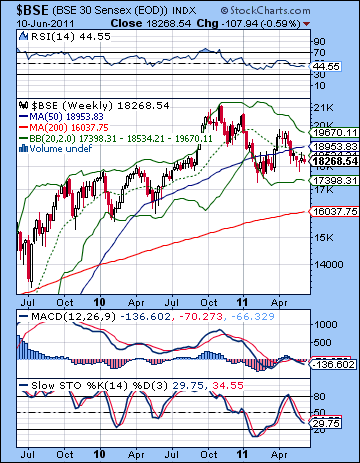 As the trading range narrows, there is a greater risk of a breakout in either direction. Bulls could not reclaim 5600 on the Nifty last week as we saw lower highs compared with the previous week. 5600 is also the approximate location of the upper Bollinger band and the 50 DMA so it is therefore important resistance. There is decent support from the 20 DMA at 5480. Perhaps more importantly, there is a possible bullish inverted head and shoulders pattern forming on the Nifty. The left shoulder at 5450 dates back to early May. If we get a similar level in the days ahead and buyers move in, it could form the right shoulder which would precede a rally with an upside target of 5850. Given the tug of war in recent weeks between bulls and bears that would seem to be a tall order indeed. And yet, if the Nifty can close above 5600, then such a move higher would be quite possible. Bears therefore have to try to prevent 5600 in the days ahead.
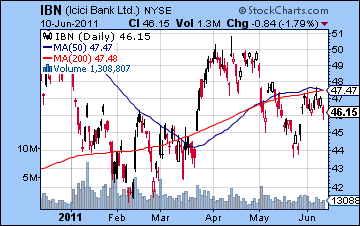
A close below 5450 would therefore be quite bearish and could jeopardize the series of higher lows we have seen in the past few months since the February low. We could then see a retest of the previous low at 5350 in short order. The indicators present a mixed picture as RSI (46) is trending lower in bear territory while MACD is levelling off and is still below the zero line. Stochastics (66) has fallen from its recent overbought levels. In other words, there is very little additional information there that would favour either the bulls or the bears. The weekly BSE chart reveals the extent of the current weakness as the Sensex is still trading below its 20 WMA at 18,534. This is a sign perhaps of the lack of conviction of bulls to launch even a modest rally. Bears can point to the possible further downside here as the bottom Bollinger band has yet to be tested at 17,398. Most previous corrections tested the bottom band and so it is quite possible that we could see a similar test in the days and weeks ahead. This would be the equivalent to 5200 on the Nifty. Meanwhile, banking stocks showed new signs of weakness last week as ICICI Bank (IBN) failed again to recapture its 50 DMA. Tuesday tested this resistance level but the stock quickly backed off and finished lower. Most investors are likely sitting on the sidelines waiting for either a close above the 50/200 DMA which would be bullish or a close below the May low which would be bearish. All this talk about a possible double dip recession was bad news for manufacturers like Tata Motors (TTM). It fell further last week and now faces an uncertain future where support is not clear. The weekly chart perhaps offers the 200 WMA as support somewhere down the line, but such a decline would represent a 30% decline.
 The planets this week look both bearish and powerful. That increases the likelihood of larger moves lower along with the possibility of sudden rebound moves also. Saturn stations on Monday while Mars is in difficult aspect with Rahu. This seems like quite a negative set up so we should expect the downside to prevail. In addition, Mercury conjoins Ketu after the close on Monday so there is a possibility of a whipsaw move, possibly signifying a late day reversal higher. Tuesday features a bearish-looking Mercury-Mars aspect which may also accompany more selling. Sun conjoins Ketu on Wednesday ahead of the lunar eclipse later that evening. This is a volatile combination that can increase the magnitude of any market moves. By itself, it is a bearish pairing, although it can also represent sudden changes in direction. I would tend to think the market stays weak into Wednesday with some kind of move higher more likely on Thursday and Friday. Mercury begins to form aspects with Neptune and Jupiter in the last two days of the week, so it seems more likely that we would get a rebound then, especially if the market moves lower beforehand. Given the technical situation, the large amount of bearish planetary influences here would tend to support the notion that we will retest support at some level lower than 5450. And even if we happen to get an up day on Monday or Tuesday, I would expect Wednesday or Thursday to put in a lower low. Perhaps 5350 is possible here. I would also not be surprised to see the Nifty fall further than that given the destabilizing effects of the lunar eclipse. The most unlikely scenario would therefore be a rise above 5600. That would be very surprising indeed.
 Next week (June 20-24) looks quite bearish to begin the week as Mars squares Neptune and Saturn squares Mercury. These are bearish influences that will likely push the market lower in the early week. I would not rule out a lower low from the previous week, although that is uncertain. 5200 is possible but not really a probability. A significant rebound looks likely in the second half of the week as the Sun aspects Jupiter and Uranus. The following week (Jun 27-Jul 1) should continue that bullish trend as Mars is in aspect with Jupiter and Uranus. This looks like a powerful move higher that could last for much of the week. Friday’s New Moon occurs in tight square to Saturn so that may mark an interim top and spark some selling. July and August do not have any strong medium term bearish indications so we could see a gradual move higher. Regardless of how low we go beforehand, I would expect a real test of resistance and the falling trend line from the 2010 high. By August that should be around 5700. It would not shock me if the Nifty climbed above that line. August may see growing weakness as Mars comes under the influence of Saturn in the middle of the month. September will likely see more deterioration in the market with new lows for the year quite possible. The lows for 2011 are therefore most likely to occur in Q4. I tend to think they will come right at the end of the year, in November or December. 4000 on the Nifty is definitely possible, although a more conservative downside target would be 4800. Perhaps the market will make a lasting low in 2012 before a more sustainable rally begins.
5-day outlook — bearish — NIFTY 5300-5400
30-day outlook — bearish — NIFTY 5200-5400
90-day outlook — bearish — NIFTY 4800-5200
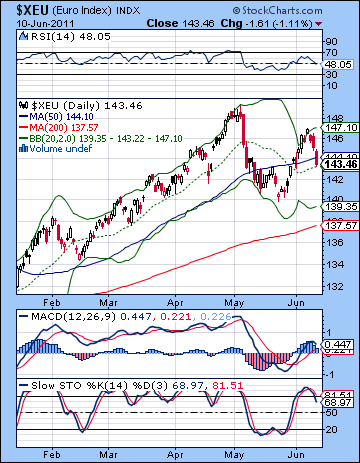 As bickering broke out between ECB and the German finance minister, the Dollar pushed higher closing well above 75 on the DX chart. With Germany refusing to pick up the tab for the Greek bailout, the Euro moved lower closing at 1.434 while the Rupee held steady at 44.72. I thought we would get more downside in the Dollar on the Jupiter-Neptune aspect but any downside was confined to the early week. The Dollar reversed on Tuesday just as it back tested the falling trend line which had previous acted as resistance. The Euro chart shows the mirror image of this move. The Dollar has shifted back to its more familiar safe haven last week as it moved inversely with equities. Previously, we had seen how it sold off along with negative US economic data. Currencies here are still very much locked in a no-hold’s barred beauty contest with some fairly undesirable contestants. It is only the Euro’s nagging woes that has provided this lift for the greenback. Certainly, the bounce off support was welcome for the bullish case for the Dollar. We can see from the Euro chart how significant last week’s decline really was. It not only fell off the trend line, but it also topped very close to the upper Bollinger band line. While Friday’s trading saw the Euro get some support from the 20 DMA, it appears to be on thin ice here. Stochastics (68) are turning lower after being overbought and RSI (48) have moved into bearish territory. MACD is still in a bullish crossover but it is not looking particularly healthy. The technical situation of the Euro will go from bad to worse if the previous low of 1.40 is taken out.
This week looks bearish if only because the lunar eclipse occurs exactly opposite the natal Moon of the Euro chart. Eclipses introduce a shot of energy into a situation, for good or ill. While it is possible that Wednesday’s eclipse could reverse the prevailing trend (from a falling Euro to a rising Euro), I think the more likely outcome is for the Euro to fall further at least in the first half of the week. The period after the eclipse therefore seems more bullish for the Euro as the Sun and Mercury enter more powerful zones in the Euro natal chart. We should expect some significant moves, perhaps in both directions here, although I would tend to think that the Dollar ends up higher, perhaps nearing 76/1.40. Next week also looks bearish for the Euro and positive for the Dollar as the Mercury-Saturn square could accelerate the trend for another 2 or 3 days. It seems more likely that we will see the Euro fall below 1.40 by this time. It’s unclear which support level will prove effective, but I suspect that a reversal higher will occur in the last week of June. July looks sideways to bullish for the Euro but I don’t expect it to make much headway. By August, it should fall on hard times again as the Dollar looks quite strong. Aside from any eclipse-fed declines we may see in the rest of June, September is shaping up as perhaps the most bearish month for the Euro. This may finally be the time when the Dollar hits 80 and the Euro falls below 1.30. The Dollar should stay strong for the balance of 2011 with higher highs likely.
Dollar
5-day outlook — bullish
30-day outlook — bullish
90-day outlook — bullish
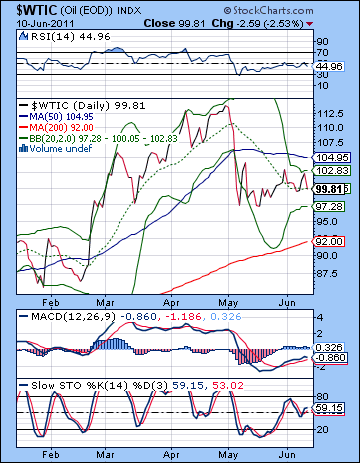 Crude oil finished lower this week on prospects of increased supply from Saudi Arabia. Crude had moved higher earlier in the week after OPEC failed to come to an agreement but ended slightly below $100. I thought we might see a little more upside on the bullish Jupiter-Neptune aspect and prices did in fact rise into Thursday when the aspect was near exact. They topped out under $103 however, and this did not test the 50 DMA in a significant way. Friday’s decline was also partially foretold by the planets as the bearish Mars-Rahu aspect reversed the up trend. While the 50 DMA was not tested, the upper Bollinger band was. Crude therefore looks somewhat overdone here as it runs up against resistance. But MACD is still in a bullish crossover and is gently rising while Stochastics (59) appears to be meandering. More troubling for bulls is that there is a head and shoulders pattern forming with the possible right shoulder at $105. We didn’t quite make it last week but if crude makes another run to this level this week, it will likely invite a lot of sellers due to this pattern. The neckline for this pattern is around $97 and the downside target would be $81. This corresponds to the rising trend line off the 2010 lows. To have a hope of fulfilling this pattern, the bears first have to break support at $95-97 (the neckline). The bulls on the other hand have to try to take prices above $106. This would reduce the likelihood of the head and shoulders pattern and would likely bring in new buyers to eventually challenge the highs of $113. While the daily technicals appear to favour the bears here, it is worth noting that the Stochastics on the weekly chart is now at 22 and moving close to an oversold condition.
This week’s Saturn and eclipse action favours the bears. The early week would appear to be the most bearish period as the Mercury-Ketu and Sun-Ketu conjunctions will activate the ascendant in the Futures chart. Wednesday’s eclipse may bring a significant reversal in the prevailing trend, however, so we could see prices rising in the second half of the week. I would also suggest there is a certain wild card quality to this eclipse that suggests large magnitude moves in either direction. Even though the chart is tilting bearish, it is conceivable that it could rise up to resistance at $105 also. However, that is the less likely scenario. I would tend to think we test support once again at $95-97. Next week will likely begin negatively on the Mercury-Saturn aspect so we could see more downside into Monday and Tuesday. That may well break support, although a late week rebound seems likely. This will probably continue into the end of June and could see crude up around $95-100 once again. The charts do not offer much bullish planetary energy, although it is possible crude could go mostly sideways into August. I would not be surprised to see crude weaken through July and have this trend extend into August.
5-day outlook — bearish
30-day outlook — bearish
90-day outlook — bearish
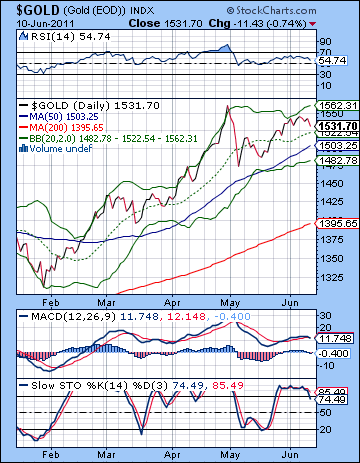 As recession fears grew, inflation worries receded and took the price of gold along with them. After trading in a narrow range, gold ended slightly lower at $1531 on the continuous contract. I thought we might see more upside on the Jupiter-Neptune aspect but gold barely budged at all. At the same time, I didn’t expect much in the way of downside from that early week Mercury-Saturn aspect as gold mostly stayed above $1530 for most of the week. Gold is still very much on a bull run here, although the inability to match its previous highs might give pause to weaker bulls. All the moving averages are rising as gold closed above its 20 DMA again. Of course, if gold drifted sideways here it could run into problems soon enough since the rising trend line from the January low comes in around $1520 — less than 1% below current levels. A breaking of this trend line would increase the likelihood of a larger correction back to support at $1450 and the longer term rising trend line. Daily MACD is rolling over here and pointing down. This is another potentially bearish technical development. The weekly chart is still overbought with Stochastics (84) and RSI (66) both suggesting that the bulls don’t have much more upside to go. While some kind of correction seems more likely here, there are no real indications how large it will be. Until $1450 is broken to the downside, there is no reason to expect gold will end its phenomenal bull market. Once that longer term trend line is violated, however, gold may fall quickly as investors head for the exits.
This week’s eclipse offers an intriguing possibility to shift the dynamic in the gold market. The Sun conjoins Ketu on Tuesday and this is one potentially bearish aspect in play this week. There is a greater possibility of a big decline here, although I am not certain it will break the prevailing up trend. The smaller trend line at $1520 is definitely in play so we could see that broken. The end of the week looks more positive, however, as the Sun enters Gemini alongside Mercury. Next week gold may recover more from any wounds it sustains this week as the Sun aspects Jupiter. This renewed strength may once again take gold back towards its previous highs, although I wonder if it will be doing a back test crawling up the rising trend line. The upward momentum is likely to wane as we approach the Sun-Saturn square aspect on July 1. This is a nasty aspect that could mark another pullback. July may be fairly choppy but there should be some upward move into August. Whether this is a higher high is hard to say. I tend to think not, but I’ve been overly bearish on gold. With the US Dollar likely to appreciate for the balance of 2011, it will be difficult for gold to hold onto current levels. So my medium term expectation for gold is that upside potential looks limited whereas the downside risk is more significant.
5-day outlook — bearish
30-day outlook — bearish-neutral
90-day outlook — bearish-neutral