

- Stocks trending down; Monday should provide key
- Dollar to rise, perhaps sharply
- Gold likely to fall further but reversal upward is possible by Friday
- Crude likely to end rally; significant declines possible
- Stocks trending down; Monday should provide key
- Dollar to rise, perhaps sharply
- Gold likely to fall further but reversal upward is possible by Friday
- Crude likely to end rally; significant declines possible
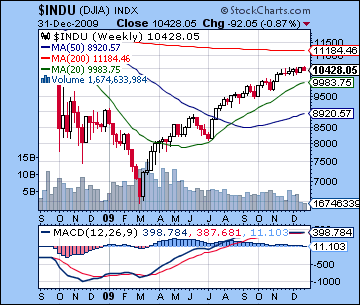
After racking up an impressive 24% gain for the year, stocks finished off 2009 on the negative note as worries over deficits caused an abrupt exit at the end of Thursday’s session before the New Year’s holiday. The Dow was down about 1% for the week closing at 10,428 while the S&P finished at 1115. This outcome was not unanticipated given my bearish stance, although I had expected the lion’s share of the decline to occur earlier in the week on the Venus-Saturn-Pluto configuration. As it happened, we saw only the smallest of pullbacks on Tuesday after Monday’s indecisive doji candlestick. The failure of the market to decline on this aspect was disappointing and offered more evidence that the medium term bearish influences such as the Mars and Mercury retrograde cycles have yet to find their voice. Wednesday ended flat despite the apparently bullish effects of Moon in Gemini. Thursday’s decline coincided nicely with the bearish Moon-Saturn aspect and that turned out to be the decisive trading day as a sharp sell-off in the final hour of trading took the indexes down from their recent highs. Overall, we are no closer to solving the current impasse in the market as the bearish influences have yet to exert much force while the bullish effects of Jupiter-Neptune continue to linger. These parallel energies have so far defaulted towards the bulls, as we hit highs for the year on Monday and Tuesday on most indexes.
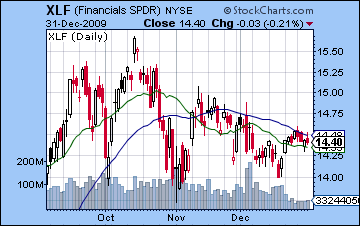
Like last week, however, we have to look at these new highs with a jaundiced eye because they occurred on low holiday volume. With many institutional traders away from their desks over the past two weeks, the first week of January looms large as volume will return to more normal levels. As if to punctuate the significance of the current circumstance, recent price action has left the S&P at a pivotal point as MACD is pointing down but has not quite formed a bearish crossover. Bulls can console themselves in the belief that even another down day or two may not be enough to generate a sell signal here and thus a wider sell-off. Last week’s highs have not done anything to alter the negative divergence, however, as we only had the most recent peak taken out by the new highs. Previous peaks were all still at higher MACD levels than last week’s, hence the downward cascading effect is still discernible. RSI at 53 is still bullish although falling and is also trapped in a negative divergence with respect to previous peaks. The three previous mini-corrections all bounced off of the 50 level so that could be an important support here. If the RSI falls below 50, then it could well fall significantly further in a short period. Perhaps more bullish evidence is found in the simple fact that prices are still above both the 20 and 50 DMA while both moving averages are still rising. The 20 DMA has been a more important support level recently but a pullback in early January would likely test the 50 DMA around 1090 fairly quickly. If 1080-1090 does not hold, the market could fall to 1040 and then 1000. The technical picture still finds evidence for bullishness through the weekly Dow chart which has been tenaciously hanging onto a positive MACD value for many weeks. While other indexes have already had their bearish crossover, the Dow is one of the few remaining to stay positive. It remains one of the key technical reasons for adhering to the bullish view. On a more bearish note, however, the financials (See XLF chart) have been lagging the major indexes over the past two months and this is perhaps a clue to an underlying weakness in the market going forward. The 20 DMA crossed over the 50 DMA back in November and it is still below it. Recent market highs have not been reflected in the financials, so that will be one sector to watch carefully as January unfolds. If financials can rise, then that would clear out some of the remaining doubt in the market and help to move it to new highs. If, however, XLF falls below its November lows of 14.00 then it may signal a deeper pullback is in the offing.
 The market will be closely watching the Fed in its continuing efforts to gently remove excess liquidity from the system as it prepares to unwind the stimulus. It’s unclear just how tricky this will be since one false move could spark a rush to the exits. One difficulty noted last week is that bond yields have started to rise as investors have demanded a higher premium on what looks to be an increasingly risky investment in US treasuries. As yields creep higher, they will become more attractive to investors seeking higher returns. This could well put more pressure on stocks as the relative safety of treasuries may be more appealing than equities, especially in light of the huge gains we have seen in 2009. Another important factor in this delicate balance is that since bond yields are so low, even a very small change is fairly large in percentage terms, and so the balance between stocks and bonds could be easily upset. For example, on Tuesday 3-month treasury yields effectively doubled, from 0.05% to 0.11%. While not a big jump in absolute terms, if the market sees a few of these large one-day moves occur in quick succession, it could alter the asset balance that has become entrenched over recent months. And as we’ve noted previously, higher bonds yields and a rising US Dollar could interrupt the lucrative carry trade which has been one of the essential engines of the stock market rally over the past several months. While Bernanke may not be raising rates anytime soon, the bond market may beat him to the punch as rates drift north. If bond yields continue to rise, this would likely be a negative for stocks.
This week looks mixed with a bearish bias as a series of fast forming aspects involving the Sun, Mercury and Venus offer another opportunity to disrupt recent price patterns. Monday’s Sun-Mercury conjunction has a bearish flavour, although the simultaneous Venus-Jupiter aspect would appear to neutralize it somewhat. With Mercury now retrograde and swimming upstream, as it were, it will conjoin Venus in time for Tuesday’s session so this may indicate a rapid change in sentiment, possibly increasing the chances of an up day. The Moon enters Virgo and a conjunction with Saturn for Wednesday so this could introduce more bearish energy. Here, too, however, some offsetting energy is present on the minor Mercury-Jupiter aspect. Later in the week could well see the bears take over as a minor aspect between the approaching Sun-Venus conjunction will set up with retrograde Mars. This is a significant opportunity to trigger some of the bearish potential of retrograde Mars so it merits close attention. Since this is only a minor aspect, this is not a certain outcome, but the configuration opens up possibilities on the downside. Generally speaking, the early part of the week may be more bullish with bearishness more likely to prevail towards the end. That said, Monday’s Sun-Mercury conjunction will likely set the tone since a significant down day (>1%) would likely translate into a down week overall. This is certainly very possible, although it is not at all certain given the offsetting influences. If Monday is down as expected, then we could end up in the lower part of the recent trading range between SPX 1090 and 1110. The chances for breaking out on the downside of this range are somewhat greater than breaking out on the upside, although next week would seem to be a better candidate for any larger moves.
 Next week (Jan 11-15) could see one or two significant down days as Monday’s triple conjunction of Sun, Venus, and Rahu could introduce new dynamics into the market equation. This promises to be a significant trading week since we will have Saturn turning retrograde on Wednesday the 13th and a partial Solar Eclipse on Friday the 15th. If the market is still clinging to current levels by then, these patterns have the capacity to shift sentiment quickly, most likely in a negative direction. The following week (Jan 18-22) is likely to see a couple of rally attempts early on in the week as both Sun and Venus form supportive aspects with Jupiter. Overall, this week could well be higher, although this outcome is more likely if we have seen a significant sell-off in the preceding week. After that, the Sun and Venus approach an opposition with Mars which could see sellers prevail and take the market lower. February opens with the second exact square aspect of Saturn and Pluto just as Jupiter forms a helpful partial aspect to this malefic pairing. I would not rule out further gains here although they are unlikely to take the market higher than current levels. Much depends on January in this regard and while the planets look more bearish in the short term, the prospects for a significant correction below SPX 1000 are fast diminishing. If we see some kind of decline this week, then such a deeper correction is still possible. If we only get a shallow correction in January, then the stage would be set for further move higher, perhaps above the current trendline of SPX 1140. In that case, a rally towards SPX 1250 would be possible over the next three months. I still don’t think that is the most likely outcome here but certainly the odds of it increase if the bears do not take advantage of some of these apparently negative planets this week and next. A more likely scenario would be a 10-15% correction in January followed by another rally attempt going into April. The longer term outlook for 2010 remains mixed at best as the Saturn-Uranus-Pluto t-square will be a major drag on the market throughout most of the year, especially in summer and fall. Given the prospect of significantly lower prices in the second half of the year, any rally we could see going into spring is unlikely to be sustained over the medium and long term. Whether or not we see the March 2009 lows taken out remains an open question. The planets are fairly negative in the fall so we cannot rule out that possibility occurring in late 2010 or early 2011. It does seem more likely that the market will be lower at the end of 2010 than it was at the beginning of 2010.
5-day outlook — bearish SPX 1080-1120
30-day outlook — bearish SPX 1000-1080
90-day outlook — bearish-neutral SPX 1000-1150
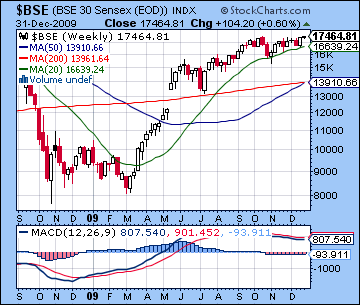
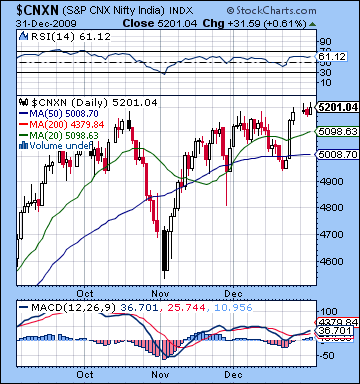 Stocks edged higher in Mumbai last week as the upbeat mood that prevailed through much of 2009 extended to the year end. In a holiday-shortened week, the Nifty closed slightly higher at 5201 while the Sensex finished at 17,464. This outcome was somewhat surprising since I had expected more downside on Tuesday’s Venus-Pluto conjunction. As it happened, the market was mostly flat and therefore provided more evidence that some of the medium term influences are not yet active. Wednesday was also mostly unchanged as whatever negativity from the Venus-Pluto was offset by the favourable position of the Moon in Taurus. As expected, Thursday was higher as the Sun added its energy to the Venus-Pluto conjunction and was enough to to wrestle any emergent Saturnian pessimism. I had been unsure about the negative potential last week and noted that any failure of Tuesday’s Venus-Pluto to deliver a decline would likely see the market end higher for the week. That more bullish scenario came to pass, although the market never really ventured above current resistance levels. For all intents and purposes, the market remains range bound here as bulls do not have enough conviction to take prices significantly higher. This is perhaps reflective of the celestial stalemate whereby the lingering optimism of the Jupiter-Neptune conjunction stubbornly refuses to be ushered off-stage by a growing number of bearish medium term influences including the Mars and Mercury retrograde cycles, and the background effect of the Saturn-Pluto square aspect. So far I have erred towards bearish caution on the probable manifestation of these malefic energies, if only to avoid being caught off guard by a rush to the exits in case of any sudden market turns.
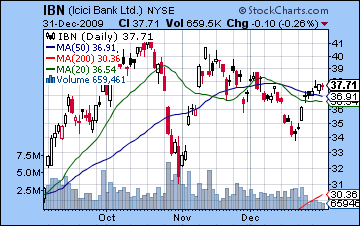
As bullish as the new highs were, from a technical perspective they may not be a reliable indicator since they occurred so close to a holiday on lighter than normal volume. Also, the highs are barely above previous highs and until there is a significant break out above the 5200 on the Nifty, one should treat the bullish view with great caution. Of course, there are numerous positive measurements that offer support to the current rally. MACD saw a bullish crossover last week as stocks bounced back from their mid-December lows. At the same time, however, the bearish divergence remains intact on MACD as new highs have not corresponded with higher levels. Now at 36, MACD is lower than it was in early December, a sure sign of flagging momentum. While this could merely be a sign of consolidation before the market moves higher, it is also very clearly growing indecision among investors as prices are encountering significant overheard resistance at current levels. RSI at 61 tells much the same story as new stock highs have only equaled previous RSI levels in November. As before, the weekly BSE chart reveals this loss of momentum and possible topping action. MACD is falling and was negative for the eighth week in a row in spite of last week’s gains and new highs on the year. All of this speaks to a struggle between bulls and bears over the next major move. While it’s possible the market could go sideways for several weeks more, there is some reason to expect prices to break down from this narrow trading range soon. The breadth of the rally appears to be narrowing somewhat, as financials have not participated in the latter stages of this rally (See IBN chart for ICICI). Since the rally is predicated on an economic recovery, financial shares should be in a healthy condition. This clearly is not the case as the ICICI chart shows the 20 DMA in a bearish crossover with the 50 DMA and a series of lower highs dating back to the October interim peak. Overall, the technical picture does not strongly support the bullish view although we did see a bullish crossover in the Nifty MACD. But until we see a similar bullish crossover in the weekly Sensex chart, one would be hard pressed to muster up a lot of enthusiasm for the market going higher.
 This week looks to have a bearish outlook as we will see a fast moving series of aspects that could produce wider price swings in both directions. Monday will see an inferior conjunction of the Sun and Mercury which tends to produce bearish results. Tuesday may be more positive as the Moon transits deeper into Leo and Mercury approaches its conjunction with benefic Venus. While somewhat more favourable, even this combination of planets may not be enough to produce major gains as the Mercury-Venus conjunction falls under the disruptive influence of the natal Ketu in the NSE chart. The Moon enters Virgo for Wednesday and will conjoin Saturn during the trading session — a bearish influence. Even if the market happens to open in the green here, it is likely to lose strength through the day and may even close in the red. Thursday could be more positive, at least in the morning as the Moon makes passing aspects to both the Sun and Venus. Friday may be more negative as both Sun and Venus are in minor aspect with Mars. Overall, a down week seems to be the most likely outcome here, with a chance of breaking below support at 5000. The extent of the pullback will be dependent in large part on the effects of the Sun-Mercury conjunction on Monday and into Tuesday. If this is strongly negative (>2%), then we could break below 5000 at some point on the week. A more modest decline or gain would likely keep the Nifty within the recent trade range, albeit towards the bottom of it around 5000-5100.
 Next week (Jan 11-15) looks more mixed, with the possibility of further declines early on followed by the likelihood of a rebound later in the week. Monday’s triple conjunction of Sun, Venus and Rahu appears quite bearish and that may increase volatility substantially. Rahu generally increases uncertainty so watch for larger price swings here. Wednesday will see Saturn turn retrograde while Mercury turns direct on Friday. Some significant gains are likely midweek as both Sun and Venus form aspects with Uranus and Neptune. Interestingly, Mercury will turn direct on the same day as a partial Solar Eclipse. This seems like a bearish influence for the end of the week. The following week (Jan 18-22) looks more bullish as Sun and Venus form aspect with Jupiter early in the week with sentiment flattening out afterwards. January may well end on a losing note as Sun and Venus will oppose Mars but some gains are likely for early February as Jupiter forms an alignment with Saturn and Pluto. Overall, January will probably be marked with downward pressure on prices that could see the market decline back to 4500. February and March seem to be more mixed to positive. It’s possible the market could reach new highs by April, but it is not at all certain. Much will depend on how much of a pullback we will see in the short term. The most likely scenario appears to be a pullback somewhere between 4500 and 4800 and then choppy sideways trading with an upward bias until early April that takes the market back to current levels but not much higher. The looming presence of the bearish t-square involving Saturn, Uranus and Pluto in the second half of 2010 will tend to depress prices and should prevent any sustained rally from making major new highs. I would not rule out 5500 in the first half of the year, but even that sounds fairly ambitious. The second half of the year is likely to see more persistent bearishness so there is a chance that we could challenge the lows of 2009. Overall, I think there is a very good chance that the prices at the end of 2010 will be lower than they were at the start of 2010, perhaps much lower.
5-day outlook — bearish NIFTY 4900-5100
30-day outlook — bearish NIFTY 4500-4800
90-day outlook — bearish-neutral NIFTY 4900-5300
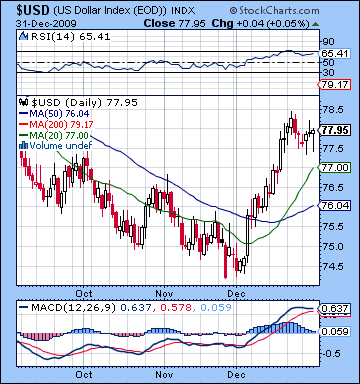 The US Dollar continued to shine last week as it put in its fifth straight winning week closing just under 78. This outcome was largely in keeping with expectations, although Monday’s decline was unanticipated. This was mostly due to the absence of any significant equities sell-off on the Venus-Pluto conjunction. Tuesday saw gains as the Moon aspect to the natal USDX ascendant fulfilled my bullish expectations. I had thought we might see more downside on Wednesday but the Dollar ended mostly flat after being in positive territory for much of the day. Thursday brought a small gain as the Moon-Jupiter contact brought about the bullish side of my forecast. With the Dollar rally now entering its second month, it has yet to undergo any substantial correction. The pre-Christmas pullback was very minor and it never came close to testing support at either the 20 or 50 DMA. This is evidence of a very strong rally and suggests that the rally has much further to go. MACD is flattening out but has yet to form a bearish crossover. RSI at 65 is still bullish although it has fallen back from its mid-December highs above 70. On the other hand, the weekly chart offers a more muted bullish view of the Dollar. While MACD is in a very positive bullish crossover, it is still mired in negative territory and is likely 1-2% below crossing the "zero" line. >From a longer term perspective then, the Dollar rally is still very much in its early stages here. For the moment, we can see that the greenback is still benefiting from both positive and negative economic news as investors see the Dollar as a possible response to the prospects of either a double dip recession or a scenario of improving growth. Overall, it’s a good time to hold the Dollar.
This week seems likely to continue the rally as the second house of the USDX is activated by the triple conjunction of Sun, Mercury and Venus. Monday should be higher as the Mercury-Sun conjunction (20 Sagittarius) forms an aspect with the natal Venus (20 Libra). Tuesday is less clear as the transiting Sun falls under the square aspect from the natal Mars. This is often a difficult influence but it’s possible we could see a gain given Mars’ positive position in this chart in the 11th house of gains. Wednesday may be another up day as Venus forms an aspect with the natal Mercury and ascendant. The latter part of the week may be marred by the effect of transiting Mars (23 Cancer) on the ascendant (22 Scorpio). When Mars transited near this degree while in direct motion in early December, the Dollar slipped back so that outcome is possible again here. Overall, however, the week should be higher, perhaps significantly. The Dollar should be fairly strong in January, although a pullback is likely between Jan 18-22. We should see the USDX hit 80 at some point in January, perhaps as soon as this week. February seems like a month of consolidation, however, so some retracement back down towards the 50 DMA is possible. March and April could well see the Dollar rallying again, presumably back above 80. It should have enough strength to eclipse whatever interim highs it makes in January.
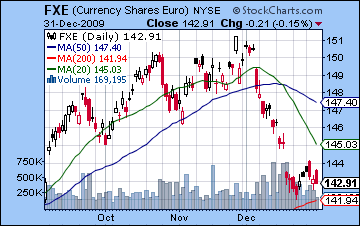 The Euro was little changed last week as it again closed near 1.43. I had expected a little more bearishness but the Venus-Pluto was mostly a bust as Monday and Tuesday were largely flat overall. While the Euro has stopped declining for now, the technical outlook is still fairly bearish as prices may be drawn to test the 200 DMA at 1.42. This will be a crucial level of support in January given the probability of further Dollar gains. If the 1.42 level can hold, then it could be a floor for prices for the rest of the winter. My sense is, however, is that it won’t hold but we will probably find more buyers move in around 1.38-1.40 before it can stage a rebound rally into February. This week looks quite bearish as the Sun-Mercury-Venus conjunction occurs in close range of the malefic aspect from natal Mars. This is most exact at the end of the week, so that time frame is perhaps somewhat more negative, but declines are possible at any time. The Euro may find its feet after January but the respite will only be temporary as the Saturn-Uranus opposition in April will set up on the natal ascendant. This is a very negative influence that will push prices down sharply once again, probably lower than current levels. The Rupee was fractionally lower to 46.6 last week on the threat of rising interest rates. This week will likely see it again trade above 47 with further weakness likely throughout January.
Dollar
5-day outlook — bullish
30-day outlook — bullish
90-day outlook — bullish
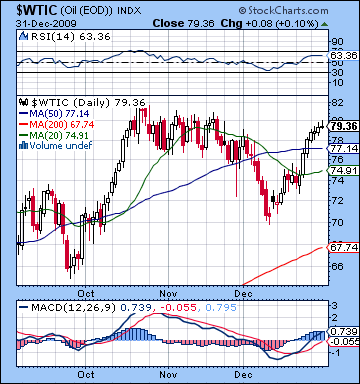 Crude continued its rally last week as it closed just under $80 on Thursday. This bullish result was not unexpected as I suggested in last week’s newsletter that the benefic effects of Jupiter-Neptune were more likely to linger with crude. Monday was up on the Venus-Pluto conjunction and this was the tip off that the rest of the week would likely follow suit. It didn’t quite make it all the back to resistance levels, but it came close. While the December rally has been impressive, crude still finds itself confronting some fairly stiff resistance at current levels. Nonetheless, MACD is still in a bullish crossover although there is still a hint of a bearish divergence here as current MACD levels are below 1.0 and hence much lower than at previous November highs. RSI at 63 is still strong and more or less echoes levels achieved in November. While there is bullish evidence in the daily technical charts, the weekly chart is less impressive as MACD is flat and now in a slight negative crossover. Unless or until crude can break above $81-82, there is no good reason to expect it move higher. Support levels are likely found around $70-72 and then $60-64.
Crude may be more susceptible to declines this week as the Sun-Mercury conjunction occurs in the 8th house in the Futures chart. The conjunction occurs Monday so that may initiate a drop while Tuesday’s Mercury-Venus conjunction could see some rebound. Overall, the first two days of the week are likely to be negative, perhaps significantly. While Wednesday’s Moon-Saturn conjunction would appear to be inimical to any gains, there is a chance for some bullish movement across the Tuesday to Thursday period. It may be that we only see one solid up day of the three, with perhaps some intraday up moves that do not hold by the close. The Thursday-Friday period looks more negative again as the Sun-Venus conjunction enters into a minor aspect with Mars. Significant declines are again possible here. Overall, we should be down substantially this week, perhaps below $75. The bearishness is likely to continue into next week but will likely reverse by the 15th. Watch for a significant bounce to occur during the week of Jan 18-22 which may continue into the following week. Crude may well stay strong into February with the possibility of new highs as we move into spring. Whether or not we see crude break above $80 by April will depend in large part on what kind of correction we get in January. If it manages to hold above $60, then new highs will become more likely. And if crude stays above $70, then new highs are that much more likely. We could see an interim high put in in late March or early April.
5-day outlook — bearish
30-day outlook — bearish
90-day outlook — neutral-bullish
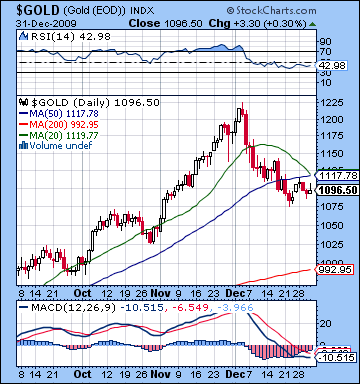 Gold continued its recent losing streak last week as it fell 1% and closed at $1096 on the continuous contract. The week unfolded more or less as expected as Tuesday saw the biggest decline on the week, although it turned out to be fairly modest. I had hedged my bets somewhat by focusing on Monday’s outcome on the Venus-Pluto conjunction, but as it happened, the day was flat, thus inclining gold towards a more bearish week overall. We didn’t quite get the rebound Wednesday although the decline was shallower than Tuesday’s. Thursday ended higher despite our bearish forecast. As negative as gold has been over the past month, it has held up fairly well. I had expected it might fall closer to $1000 by this time, so that should seen as evidence of its resilience which could help prices going forward. MACD is still in a bearish crossover here although the lines are flattening somewhat. RSI at 42 is bearish but it is worth noting that it is a little above its worst December levels, a sign of possible reversal in the near future. The weekly Gold chart is only now showing the first week of a bearish crossover in MACD, and even then it is so small as to be almost negligible. If gold should reverse its trend this week, it could well avoid a meaningful crossover and continue higher. In fact, gold’s current level is very close to the rising trendline dating back to its October 2008 lows. If gold holds onto its support near these levels, it will likely make another rally attempt. If it takes another move down, the next level of support would be around $1000 and the 200 DMA. Overall, I think the technical picture offers genuine hope to bulls, at least for the short term as a bounce may be in the cards here.
This week may start off poorly for gold but gains may be more forthcoming as the week progresses. The Sun-Mercury conjunction on Monday may see more selling as Mercury’s retrograde influence is unlikely to do the Sun any favours. But we could see a rebound as early as Tuesday on the Mercury-Venus conjunction. Another important factor here is that transiting Mars (23 Cancer) will finally move away from the natal Moon (24 Capricorn) as it continues its retrograde journey back into Cancer. This is likely to have a supporting effect on prices in the medium term. The late week period is harder to call. If we do see more declines, they are unlikely to be large as the transiting Jupiter aspect to the ascendant in the GLD chart is fast building towards its exact angle. Generally speaking, any declines we see after this week are more likely to be short-lived, at least until February when the planetary terrain again looks more challenging. Prices could stay bullish until as late as Jan 25. It is possible we could see gold go back to its highs, although that seems less likely from a technical standpoint. The first and second week of February stands out as a bearish period for gold it could see some sizable declines at that time. In all likelihood, this looks like the beginning of another significant leg down as the correction will accelerate in early March. It may only be then that gold breaks below significant support (around $1000?) and discourages the gold bulls sufficiently to set up deeper moves lower in the months ahead.
5-day outlook — bearish-neutral
30-day outlook — bullish
90-day outlook — bearish