

- Stock rally likely to continue; strength focused in early week
- Dollar to slide towards support levels
- Gold rebound to continue, probably above $1150
- Crude trending higher
- Stock rally likely to continue; strength focused in early week
- Dollar to slide towards support levels
- Gold rebound to continue, probably above $1150
- Crude trending higher
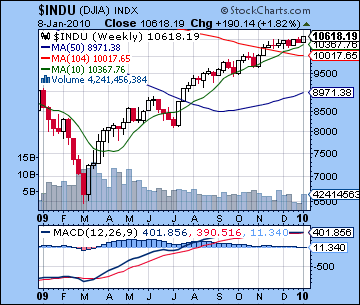
Stocks in New York started the new year off on a positive note as encouraging retail sales extended the rally for yet another week. Taking a lead from Monday’s big gain, the Dow closed up 3% on the week at 10,618 while the S&P finished at 1144. I had been more bearish here thinking that the Sun-Mercury conjunction on Monday might take markets down before they could rebound on Tuesday. As it happened, the close proximity of Sun, Mercury and Venus erased any negativity as the minor aspect between Venus and Jupiter offered more than enough bullishness to counteract retrograde Mercury. The inability for any sell-off to manifest Monday meant that the major obstacle for the market was now out of the way and stocks rose on all five trading days. As disappointing as this outcome was, it was not completely unexpected as I had noted a number of mixed influences along the way. The late week effects of Mars also had its fangs removed as the approaching Sun-Venus conjunction appears to have coincided with bringing more buyers into the market. It should be noted, perhaps, that Friday was negative for much of the day only to have the bulls take over at the close. So we seem to still be in a bullish environment where positive aspects (like the Mercury-Venus conjunction) are able to overwhelm the negative ones such as the Sun-Mercury conjunction and the Sun-Mars aspect. I had thought we might have seen a greater shift in medium term influences but it’s clear that the difficult planetary influences are still being marginalized by favourable aspects such as the now separating Jupiter-Neptune conjunction or even the semi-sextile (30 degree) aspect between Uranus and Neptune.
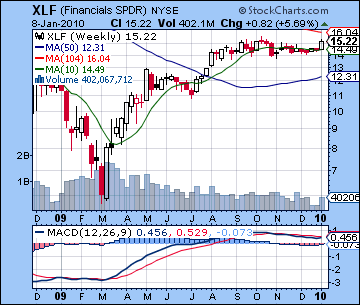
Even with last week’s solid gain, the technical picture seems mixed. Volume was higher than the holidays but more or less fell in line with the Nov-Dec average. So while stocks made new highs, the volume did not significantly increase and therefore should not be seen as heralding a huge new bull run. New highs are always bullish at some level, but here they reached towards the upper trend line of rising highs put in since March. The market therefore remains in this rising wedge pattern, albeit moving towards its upper side of the mini-wedge that has formed since November. While potentially bullish in the short term, the rising wedge pattern (both its mini since November and its standard form since March) is not a medium or long term bullish indicator. Indeed, it often denotes a bull rally within a larger secular bear market. Admittedly, this rally is no ordinary rally as it enters its eleventh straight month — a very impressive run by any measure. Any pullbacks along the way have been short and shallow and mostly limited to less than 10% on the downside. Sentiment is very bullish as standard indicators such as $VIX are near their lows. Again, there is nothing necessarily negative about this high level of bullish sentiment in the short term as momentum players will likely continue to try to drive up prices and buy on the dips. That is one reason that the next dip will likely be bought with the same enthusiasm that has marked previous corrections. But the medium term outlook suggests that stocks would appear to be in greater jeopardy as extreme bullishness is a contrary indicator and a sign of complacency. With everyone on the bullish side, there is no one left to convert as the supply of new buyers dries up, and the market begins to unravel. But until that time comes, momentum is still positive as daily MACD on the SPX chart is in a bullish crossover. We can still point out a negative divergence here as MACD at 11 only matches its previous peak which occurred at lower levels in November. This is not a stark divergence but it is another measure of slackening momentum. RSI at 66 offers a stronger picture as it has bested immediately preceding peaks while the S&P has made higher highs. But from a weekly perspective, MACD is less impressive. The Dow is still slightly positive, as is the SPX, but the wider NYSE Composite ($NYA) is still negative even after this week’s strong gains. The same goes for weekly MACD in the XLF chart. It currently sits exactly on the falling trend line from the Oct 2007 and May 2008 tops. One might say it stands at a crossroads, as higher prices next week would push it above this trend line and perhaps hint at a significant breakout on the upside. But its weekly MACD is still negative and until its turns positive, it is hard to be overly optimistic about the medium and long term prospects.
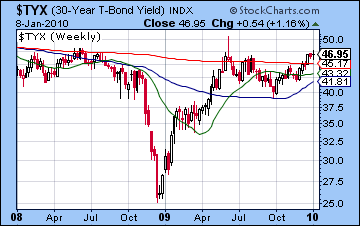 The Fed continues to make noise about reducing liquidity but it has yet to follow through on much of its promise. As a possible sign of things to come, China’s central bank increased its 3-month interest rate in an effort to squeeze out liquidity and keep a lid on an emerging inflationary bubble in that country. While Bernanke may not raise rates anytime soon, bond yields continue to drift higher. The yield on the 30-year treasury in fast approaching 5% (see chart), a potentially significant psychological point of resistance. It also happens to correspond with a more technical point of resistance as that matches several yield tops over the past 18 months. Should the market take yields above that level, it may force Bernanke’s hand to tighten liquidity more aggressively. In that respect, the upcoming auction this week of $75 billion in treasuries will be worth watching. If yields go higher, then that will turn the screws on the Fed and hasten the moment of tough choices — whether to protect the currency and the government’s ability to borrow to finance its debt or to protect the equity markets. The possibility of holding up both sides of this equation seems remote. In any event, there is a chance that yields will not be able to break above its recent highs as treasuries will again be regarded as instruments of safety. This outcome would of course correlate with a stock correction where risk is penalized as Dollar-denominated bonds would benefit. From an astrological perspective, I note that Monday’s triple conjunction of Sun-Venus-Rahu at 27 degrees of sidereal Sagittarius will occur in exact trine aspect with the ascendant of the US Treasury market horoscope (Aug 22, 1977). So there is some reason to expect some interesting developments this week involving treasuries, perhaps as a high-water mark for yields. It will definitely bear watching.
 This week begins with that triple conjunction of Sun, Venus and Rahu. Rahu (the North Lunar Node) is often a disruptive element but it is also a symbol of speculation and shadowy forces. There is quite a bit of energy in this configuration so a big move is very possible, perhaps on the scale of last Monday. On balance, the polarity of these influences seems positive so another big up day is the most likely outcome. Alternatively, the triple conjunction could be the culmination of a short term up trend so we could open higher but then lose steam through the day. Tuesday presents a compelling dilemma. On the positive side, Venus forms a nice sextile aspect with Uranus but will be separating away from the Sun and its conjunction so some of that positive energy may be lost. I would still lean towards the positive outcome here, albeit cautiously. Saturn turns retrograde on Wednesday and thus begins its five-month retrograde cycle. This is another potential turning point that deserves out attention, especially coming as it does in the same week as Mercury’s switch to forward direction and a solar eclipse. For its part, Wednesday looks most negative as the Moon conjoins Mercury and Pluto in the morning. Another bounce is possible on Thursday as Sun and Venus enter Capricorn in minor aspect with Neptune. Friday could be bearish as the difficult Mercury-Saturn-Pluto pattern may be over-amplified by the eclipse rays. Overall, a very up and down week is possible with some significant upside especially if Monday is positive. If Monday’s gain happens to dissolve by the close, then the chances for a down week will be greatly increased. Overall, however, I would lean towards a positive outcome. That said, the clustering of late week influences are something of a gauntlet for the market. While the short term aspects are on balance positive here, the simultaneous direction changes for Saturn and Mercury could add to the medium term bearishness. The presence of the solar eclipse could intensify sentiment and prompt steeper drops on down days. I don’t think this is likely, but it is certainly more possible than it otherwise would be.
 Next week (Jan 18-22) is likely to follow the prevailing pattern of early week gains ("mutual fund Mondays") as both Venus and Sun form aspects with Jupiter. The late week period may be more mixed to negative as Sun and Venus form aspects with Saturn. Overall, this could well be an up week although much will depend on the size of the gains early in the week. The following week (Jan 25-29) looks more bearish as Venus and the Sun oppose Mars. These look like solid down days. After that, we will have another exact square aspect between Saturn and Pluto which will be aspected by Jupiter in early February. The Saturn-Pluto square has yet to bear bearish fruit (!) and its first exact aspect in mid-November passed without incident. These slow moving aspects are often harder to pin down since their energy can be released in a variety of situations, some predictable (Oct 2008) and some not so predictable (Sept 2009). The Jupiter element in this mix could well push prices higher but it could also mark an interim high. February seems mixed at best so there is a good chance the rally may not have further to run. I would not rule out higher highs here, with SPX 1160 quite possible. But generally, I think the market is looking mixed with more choppiness as bulls will try to push prices higher but will probably be quickly followed by profit taking as the market seeks in vain for direction out of the rising mini-wedge. If it breaks substantially higher than the mini-wedge (above about SPX 1160), then it will re-enter the boundaries of the larger wedge and increase the odds of a run towards 1200 or even 1250. It may take until March and April before we see a significant downward move in this market. Of course, it could happen sooner but we should first await the outcome of the Saturn retrograde cycle that begins this week. It’s conceivable that it could coincide with a significant high and that the market starts to fall thereafter. The bullish patterns for Jan 18-22 would therefore not represent new highs but rather rally attempts to match highs made early this week. In astrological terms, significant market highs usually correspond with a multiplicity of simultaneous aspects. We have a high number of aspects this week so that is a candidate for a major top. But early- to mid-February also features a large number of simultaneous aspects so we cannot rule out a significant high occurring then, perhaps near SPX 1200-1230. This would represent resistance of the upper trend line of the rising wedge that dates back to summer 2009.
5-day outlook — neutral-bullish SPX 1130-1160
30-day outlook — neutral-bullish SPX 1100-1180
90-day outlook — bearish-neutral SPX 1050-1150
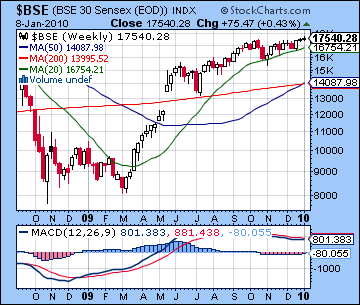
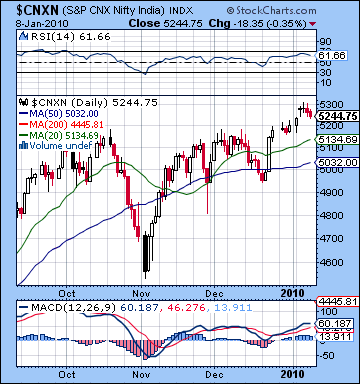 Stocks opened the new year on the plus side as recovery optimism overshadowed late week anxiety over valuation levels on large caps. Holding onto early week gains, the Sensex was higher by less than 1% closing at 17,540 while the Nifty finished at 5244. I was more bearish here mostly under the expectation that Monday’s Sun-Mercury conjunction would produce more selling. This did not occur and the market was consequently more bullish as Tuesday’s positive Mercury-Venus conjunction ruled the roost. Certainly, I had allowed that Tuesday would be more positive than Monday and that in fact transpired, although at higher than anticipated levels. Wednesday was fairly flat and was largely in keeping with the middling forecast. Late week was mostly negative as expected as Thursday’s early bullishness did not hold with the passing of the Moon’s aspect to Sun-Venus. Friday was modestly lower on the Mars aspect to the Sun-Venus conjunction. Overall, the market remains in a bullish bias amidst growing signs of indecision. This is reflected in the fact of negative planetary influences such as the late-week Mars aspect are producing only minor declines (<1%) while the mixed pattern of the fast-moving Sun-Venus-Mercury conjunction brought about a bullish outcome. This is an expression of tenacity of the underlying positive medium term influences that, for the moment at least, are refusing to leave the scene. I had expected the bullishness from the Jupiter-Neptune conjunction to have worn away now that these planets are separating. While this optimistic pairing is still very close together in the sky, I had expected its effects to have ebbing by this time, especially in the face of the gathering bearish forces — the formidable Mars and Mercury retrograde cycles, and the ongoing Saturn-Pluto square. I have clearly overestimated their negative influence thus far.
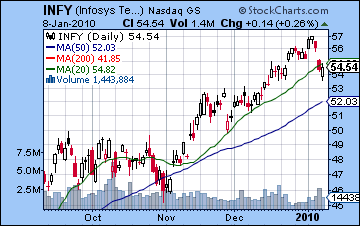
Despite the new highs for 2010, the market still seems somewhat indecisive here as gains have been modest and have not occurred on confirming high volume. While it’s possible the market could continue to edge higher, the technical signals remain quite mixed and do not clearly indicate a significant breakout higher. Certainly one can see the bullish momentum in the daily Nifty MACD chart as last week’s gain extended the bullish crossover for a second week. But momentum also shows signs of weakening as current MACD levels (60) are essentially the same as they were back in November while the market has moved higher. This suggests a small bearish divergence that should somewhat undermine the confidence one might have in this current rally. More troubling perhaps for bulls is that the weekly BSE MACD chart is still in a bearish crossover, even after that last two positive weeks. This is another indicator of slackening momentum. This could be seen as evidence of a more cautious consolidation phase before moving higher or a sign of flagging confidence in the rally which will be followed by a significant correction. The slowing momentum is reflected in the fact that the rising trend lines are gradually flattening out. Since November, the market appears to be following a flatter, more neutral looking resistance line than the steeper resistance line that traced out the highs from May to October. If the market cannot break significantly above current levels, it will remain locked in this shallower upward wedge pattern. A breakout higher will re-establish the May-October trend line. Currently that line goes to 20,000 on the Sensex and should be seen as the most bullish scenario for stocks. A shallower bullish trend line follows the Oct-Jan tops and extends to about 18,000 by March-April. While I do not think either bullish scenarios are probable, the second is somewhat more plausible as a correction would likely bring in bulls buying the dips as they attempt to bid up prices. As a potential picture of the future market direction, recent weakness in the Infosys chart (INFY) reveals the difficulties faced by the outsourcing and export sector as the Rupee is expected to appreciate through 2010. This would put pressure on profits and would likely be reflected in lower share prices.
 This week will feature several important planetary measurements that could well be bullish in the short term but have longer term bearish consequences. On Monday and Tuesday there will be a very tight triple conjunction of Sun, Venus and Rahu. Rahu symbolizes speculation and distortion and is often singled out as troublesome, but its combination with Venus here may generate more buying. On balance, this looks positive so early week strength is more likely with Tuesday looking somewhat more positive of the two days. Wednesday is more of a conundrum since Sun-Venus will form a very nice aspect with Uranus. If this was the only significant aspect, it would suggest a strong up market. However, Wednesday is also the day when Saturn turns retrograde and thereby increases its influence over sentiment. In addition, the Moon will conjoin Pluto and again activate the Saturn-Pluto square. One possible resolution to these conflicting influences is that the market may open higher but may weaken near the close as the Moon-Pluto influence grows. Thursday offers another positive day as Sun-Venus are in aspect with Neptune. Friday will be marked by a solar eclipse and a change in direction for Mercury as it stations in close conjunction with Pluto. This seems like quite a negative influence for both the short and medium terms. Combined with the Saturn retrograde just two days earlier, these are patterns that deserve close scrutiny for their implications in the weeks ahead. Overall, I expect the week to be positive, especially if Monday and Tuesday see gains on the Sun-Venus-Rahu conjunction. But eclipses can be significant indicators of market turns so investors need to be cautious. Declines are more likely to occur as the week progresses.
 Next week (Jan 18-22) will likely begin positively as Venus and the Sun form aspects with Jupiter. By Wednesday, however, there could be a shift in sentiment as the Moon enters Pisces opposite Saturn. Thursday would appear to be fairly bearish here as the opposition is closest. Despite some negativity towards the end of the week, it’s very possible this could be an up week. The following week (Jan 25-29) looks more bearish, however, as both Venus and the Sun will come under the full strength opposition aspect of Mars. After that, Saturn will make another exact aspect with Pluto as it now moves retrograde. This could be a significant market in the development of medium term trends, particularly since Jupiter will join the alignment in early February. While this could be positive in the short term, it could also signify a peak in prices. On 9 February, there is a close four planet alignment of Mars, Jupiter, Saturn and Pluto that could correlate with a market turn. The time around this date will also bear watching as will 16 February when Venus conjoins Jupiter. Given the recent strength, I certainly would not rule out higher highs in early to mid-February. Looking further afield, the spring will see a return to close aspects between Saturn, Uranus and Neptune in April and May which will partially mimic their September pattern. The possible difference here is that Jupiter will not be closely involved so there is a greater likelihood that bearish sentiment will prevail. So that is another possible time of a significant decline in stocks.
5-day outlook — bullish NIFTY 5300-5500
30-day outlook — neutral-bullish NIFTY 5000-5800
90-day outlook — neutral NIFTY 4700-5300
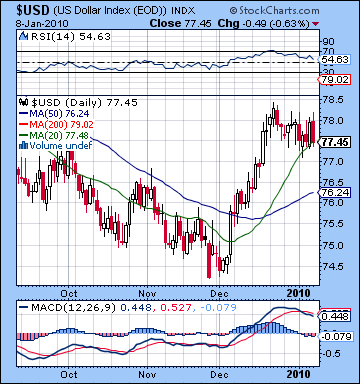 The Dollar finally had its winning streak broken last week as it fell almost 1% to close around 77.5. I had been too bullish here, mostly on the mistaken belief that Monday’s Sun-Mercury conjunction would drive investors to the greenback. Instead, the reverse happened as the Dollar showed weakness. After that, the week was mostly a wash as Tuesday’s gain highlighted the Venus activation in the USDX chart. Thursday’s significant bounce was largely negated by Friday’s sell-off, a possible reflection of the difficult Mars influence in the natal chart for the Dollar index. While the outcome was disappointing, it did little to change the bullish technical outlook for the dollar. Admittedly daily MACD now shows a bearish crossover as one might expect from recent weakness, but after the significant December rally, some consolidation was in order. RSI at 54 is sliding but it still bullish and remains higher than it has been for several months. As a signal of a longer lasting rally, the weekly MACD is still in a bullish crossover and rising, although it remains in negative territory. More than anything, this suggests just how far the Dollar rally has to go, as the zero crossing will likely mark another significant step in its recovery in the weeks ahead. Despite its recent weakness, the Dollar is still trading at its 20 DMA. Should this level hold here, it would mark a very strong continuing rally. A more likely scenario is that the Dollar will continue to retrace down to its 50 DMA around 76-75.5 in the coming week or two before moving higher. This would mark a full 50% retracement between recent top and bottom.
This week looks difficult again as Mars aspects the natal ascendant while Jupiter moves towards a square aspect with natal Saturn. The Mars aspect sent prices lower in November was moving forward, so it seems to be a likely outcome here. We could see some recovery on Wednesday on the Moon-Pluto conjunction, and Friday may well be positive also on the solar eclipse. Overall, the bears may carry the week here although the up days are likely to mitigate the losses. Next week is likely to begin very bearishly as Venus and then the Sun (6 Capricorn) come under the aspect of the natal Saturn (6 Scorpio). If support at the 50 DMA is going to be tested, this is a possible time for it. The following week (Jan 25-29) looks much more positive as Venus and the Sun will conjoin the natal Jupiter in the DX chart. We will likely see the resumption of the rally at this time. While we will likely see some significant declines around Feb 10-12, the dollar will likely continue its upward move next month. Generally speaking, the second half of February and early March look very bullish for the dollar so we could finally see 80 on the index by that time.
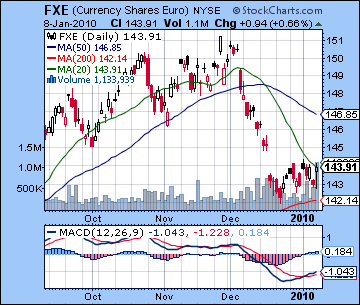 The Euro finally picked itself off the floor last week as it gained about 0.5% and closed above 1.44. I had been more bearish here on the expectation that the Sun-Mercury would be more damaging to risk appetite but was proven wrong by this outcome. The proximity of the conjunction to the natal Sun (16 Sagittarius) is one possible explanation of the supporting planetary signature. Last week I wondered if the 20 DMA would hold around 1.42. So far it has and with the prospect of further gains this week I may have to revise my medium term outlook somewhat. The technical picture is still uncertain for the Euro. Daily MACD shows a bullish crossover but it has yet to form on the weekly chart, a possible sign that the up trend has yet to take root. And while the daily MACD is moving higher, it is still mired in negative territory. Friday’s close was very close to the 20 DMA, a sign of hesitancy ahead of future moves. It seems less likely that the 20 DMA will act as resistance in the near term and indeed it is more likely that it will act as support. Watch for more strength in the Euro this week as the Sun-Venus-Rahu forms a sextile to the natal Jupiter early in the week. The bulk of the gains may occur Monday and Tuesday. The late week period may be more negative as the Sun-Venus conjunction occurs near the natal Venus in the Euro chart. While this is normally a very positive influence, the difficulty here is that Venus is in a harsh square aspect with Saturn in the natal chart, so the approaching Sun-Venus may trigger that larger negative pattern. It is still conceivable that it will rise on Friday but it seems less certain than the early week strength. Next week looks even more positive, at least at the outset. Overall, this rebound rally in the Euro looks like it could go back to the 50 DMA at 1.47. It will likely run out of gas by mid-February at the latest, however, as retrograde Saturn winds its way back to the ascendant. The Rupee surged last week on brightening Indian economic prospects closing near 45.6. I frankly missed this rally as I expected more risk aversion to result from the Sun-Mercury conjunction. This strength should continue this week and into next although it may falter as we move towards the end of January.
Dollar
5-day outlook — bearish
30-day outlook — bearish-neutral
90-day outlook — bullish
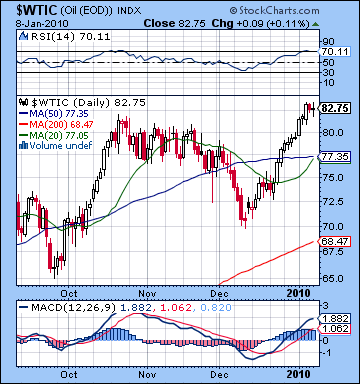 As belief in the recovery spread, crude oil rose to new highs closing just under $83. I missed this run-up on the misinterpretation of the early week Sun-Mercury conjunction. It seems there was a lot more bullish fuel left in the tank of the Jupiter-Neptune conjunction than I imagined. Since this occurred near the Midheaven (10th house cusp) on the Futures chart, it seems to have an intensified effect even after it has past exactitude. In addition, Jupiter aspected the natal Rahu last week and this could be seen as another source of strength. The technical picture is improving although it still contains some signs of vulnerability. Daily MACD is in a positive crossover but this crossover is still barely noticeably on the weekly chart. MACD still shows a bearish divergence as its current peak is lower than its October peak. RSI at 70 is moving into overbought territory but given its recent strength, it could still have further to go. One interesting thing about the new high is that it was not duplicated in the popular oil ETF USO where closing prices were still 2% below October highs. Even with these points of caution, it’s conceivable that crude could continue its rally until $90-92 which would represent its 50% retracement level as measured from its July 2008 top to its December 2008 low.
This week offers another possibility for further gains as the Sun-Venus-Rahu conjunction will aspect the ascendant in the Futures chart. Interestingly, this occurs in the malefic 8th house so that is something of a conditional call. Nonetheless, since it will be activating Uranus at the same time, there is a reasonable chance to expect that the positive side of this pattern will prevail. While some profit taking may occur between Wednesday and Friday, crude is likely to add to its recent gains. Early next week also looks quite positive as the Sun and Venus will aspect Jupiter. After that, some consolidation will occur but crude has a good chance to stay at or above its 50 DMA at 77. The outloook is fairly bullish going into February so a significant pullback seems less likely until mid-February. So that $90 resistance level may well reached as long as crude does not suffer any huge one day drops. Such declines are not out of the question given patterns like the upcoming eclipse on Friday, but it seems that the surrounding positive aspects could be enough for the strength to continue. More thoroughgoing weakness is more likely to occur in April and May when Saturn approaches its station around 4 degrees of sidereal Virgo. This will set up a difficult aspect with the natal Rahu and so the larger price decline in percentage terms is more likely to occur in that time frame. So even if we do get a correction in the coming week or two, it is unlikely to be significant in percentage terms or in duration compared to what is probable in the spring.
5-day outlook — bullish
30-day outlook — bullish
90-day outlook — neutral
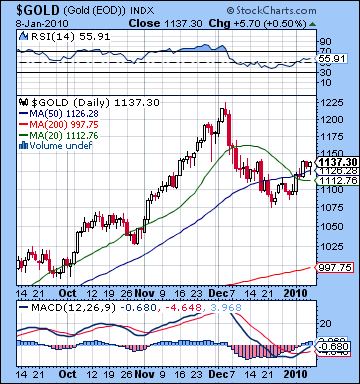 As expected, Gold bounced last week closing at $1137 as investors did some bargain hunting after several weeks of losses. While I anticipated gains here, Monday’s big run-up arrived at least a day ahead of schedule as the Sun-Mercury conjunction turned out to be very positive for gold. While Mercury’s influence was more equivocal, it may have been the close proximity of Venus that transformed the configuration into a more purely positive outcome. I had wondered if the late week would be more mixed as indeed Thursday and Friday were net flat as the Mars-Sun aspect acted as a drag on prices. So now that the negative influence of Mars finally moved off the natal Moon, gold has taken flight as I thought it might. And with Jupiter moving into a favourable aspect with the ascendant on the GLD chart, we can expect to see more upside in the near term. Gold shows a bullish crossover in its daily MACD chart, a sign of gathering momentum. However, it is still in negative territory as one or two more days of gains would see it cross the zero line and this could further increase positive sentiment. Gold closed Friday above both its 20 and 50 DMA averages, another sign of returning enthusiasm. The weekly MACD chart is even more encouraging to bulls since even after the huge sell-off in December, it has only experienced a tiny bearish crossover. More gains this week and next would push it again into a bullish crossover. Resistance levels now may begin around $1150 which would represent a 50% retracement from the recent top to bottom. I believe that gold will likely have more upward strength than that, so another run towards $1200 is quite possible here.
This week gold looks fairly positive as the early week Sun-Venus-Rahu conjunction seems likely to increase positive speculative interest in gold, which is normally symbolized by the Sun. I would not rule out a big move here as the sextile aspect with Uranus could offer additional support. While a decline is possible on Wednesday, the balance of the week seems bullish. Friday’s eclipse could even see further gains since the transiting Sun (1 Capricorn) will aspect Neptune (1 Aquarius) and this could activate the natal Venus (1 Libra) and natal Sun (2 Scorpio). The rally will likely continue into early next week (Jan 18-22) on the Sun-Jupiter aspect but the enthusiasm should fade somewhat after that. A down week will likely follow that could negate some of the gains we see this week and next week, but gold will likely still be higher than its current price by the end of January. February will probably start bullish and then weaken after the Jupiter-Saturn-Pluto aspect in mid-month. Gold seems more likely to break below its previous December low ($1075) by early March.
5-day outlook — bullish
30-day outlook — bullish
90-day outlook — bearish