

- Stocks weak early with gains more likely after
- Dollar likely to rise to 80 but may not hold there by Friday
- Gold still negative but some gains possible by end of the week
- Crude could rebound later in the week and should stay above $70
- Stocks weak early with gains more likely after
- Dollar likely to rise to 80 but may not hold there by Friday
- Gold still negative but some gains possible by end of the week
- Crude could rebound later in the week and should stay above $70
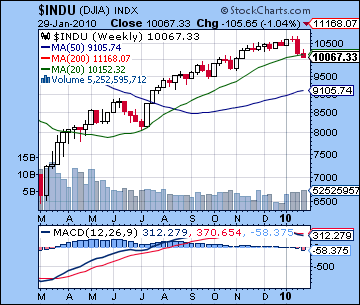
Not even the confirmation of Fed Chair Ben Bernanke on Thursday was enough to stem the rush of money heading to the exits this week as worries grew over the possibility of a Greek sovereign debt default. After gamely treading water earlier in the week, stocks ultimately lost almost 2% as the Dow closed at 10,067 while the S&P finished at 1073. This bearish result was largely in keeping with expectations, there were no big capitulatory blowouts as the market managed to avoid the worst. While the December lows of 1085 were breached as I thought they might, I wondered if the November lows of 1040 might also might be tested. As it happened, Monday turned out to be mildly positive and that prevented a more serious decline from taking hold. I had been somewhat ambivalent about the possibility of a gain Monday so this result was not too much of a surprise. I had predicted that we would see at least one down day either Tuesday or Wednesday and indeed Tuesday was down, albeit only modestly. Wednesday’s small gain was a little anomalous given the difficult Moon-Saturn aspect while Thursday saw the early effects of the Sun-Mars aspect as the market fell after the Fed meeting in the afternoon. The Sun-Mars opposition was exact Friday and not surprisingly, we saw the market fall again. What was unexpected, however, was the gain in the morning on the positive Q4 GDP numbers. The market rose into a minor Moon-Jupiter aspect and (thankfully) fell afterwards as the Moon came under the increased negative influence of Mars. Even if the decline was more modest than expected last week, the market is still very much in a corrective phase here in the aftermath of the January 15 Solar Eclipse. So far, that eclipse and the near-simultaneous reversals of Mercury and Saturn is holding up as a possible turning point in the market.
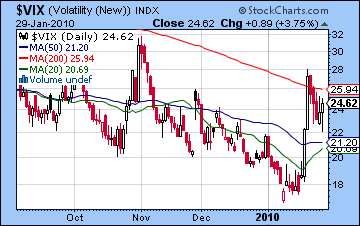
With the correction now under way, the question becomes: how long will it last and how far will it go? Thus far, prices have fallen about 7-8% and roughly match the scope of the October or November corrections. In other words, it still can qualify as a garden variety pullback after which the bulls can expect to regain control and resume the rally once again. As pointed out last week, however, this correction has already thrown some cold water on that belief since the December lows were broken with Friday’s late sell-off. Bulls now have to think twice before committing new money to the market since we have broken the reliable pattern of successive higher lows. The technical picture was further weakened by last week’s trading since the market failed to close above 1100 on five straight days after achieving that level on an intraday basis. 1100 is therefore a significant resistance level should we see any rally attempts this week. The Daily SPX RSI at 33 is falling sharply and has not seen this level since the major July correction that saw a haircut of over 15%. Volume rose on the two bigger down days, another sign of bearishness, although one gets the sense that there are still many bargain hunters out there buying the dips as they look ahead to the next leg up. MACD is plunging now and has fallen below the zero line marking a significant shift in sentiment. CCI at -148 is still deeply in the red and now has significant padding to withstand a rally before it breaks above -100. In other words, there is a technical potential for an extended correction here as this week’s rally attempt may not be enough to convince enough bulls to go long and take the market back above the 1100-1110 resistance level. The weekly MACD in the Dow chart shows another and larger week of negative crossover. The $VIX volatility index has moved up also and has closed the week above its 50 DMA, the first time it has done so since early November. With the market in a correction phase, support levels take on a special importance. The next key support level may be the November lows of 1030-1040, which could be tested early this week. If these were to fail, then it would be a very bearish technical signal and likely prompt many medium term bulls to take more money off the table. While I suspect they will be breached sometime in February, I don’t expect them to be broken this week. Of course, the Dow falling below 10,000 would be noteworthy since it is a psychological support level — and the market is ultimately driven by nothing else if not psychology — so that could also bring more sellers into the market. Given the proximity of the Dow to the 10K level, this could occur early this week. If 10,000 holds, then it could provide a short term floor.
 While Bernanke was successfully reappointed as Fed Chair, he had more negative votes than any previous Fed Chair confirmation. So it seems that he will be on a shorter leash this term as popular opposition to bank bailouts will resonate more strongly since we are in a midterm election year. Bernanke’s reluctance to come forward with all the details of the Fed’s maneuvers during the meltdown may come back to haunt him should he need to act quickly again. This is very possible during 2010 since Greece has taken one more step to default as its long bond spread is over 370 basis points compared with German bonds. Spain and Portugal are also seeing investors demand a higher return on their sovereign debt as rate spreads have edged over 150 basis points. If credit markets again seize up in the event of a series of sovereign defaults, the Fed may have to step in and provide another dose of instant liquidity. But this time Bernanke may find his Congressional overlords somewhat less indulgent to his closed door machinations. With increased skittishness in financial markets over the past two weeks, we have seen yields fall once again as more money is moving out of equities and into bonds. This is likely to continue for the near term as the Dollar continues to strengthen against most other currencies. One interesting negative development for the Dollar occurred with President Obama’s State of the Union address. In his new focus on jobs, Obama talked about the need to boost exports. One of the assumptions of export-led growth is a low dollar and while few are taking Obama’s plan too seriously, it is worth noting that the logic of it is sharply at odds with the oft-stated "strong dollar policy" of most US administrations. On the other hand, Obama has also attempted to address fiscal concerns by instituting a spending freeze over a variety of government sectors. Given that neither of these initiatives are likely to change the overarching trends in trade and government spending, they are perhaps best seen as mostly offsetting influences. The Dollar will therefore likely continue to rise, especially against the Euro which is now seen as increasingly hamstrung by the weaker members of the EU. As frequently noted, a rising Dollar is bad news for stocks in the medium term because it makes US stocks less appealing to foreign investors and it diminishes the profitability of the carry trade.
 Unlike last week, this week offers more opportunities for a rally, although that would appear more likely in the latter half of the week. This week may well divide according to the Mercury-Rahu conjunction that takes place very early on Wednesday morning. Rahu is a planet of uncertainty and chaos, so it’s immediate effects here are hard to predict. One possibility is that prices will continue to fall before the conjunction while a rebound becomes more likely afterwards. In addition, there are partial aspects between both Venus and Mercury to pessimistic Saturn on Monday and Tuesday, so that may well encourage more selling. Tuesday could be the worst of the two days as the Moon conjoins Saturn right near the close of trading. Wednesday could see a sizable gain, especially in the afternoon as Moon forms a nice aspect with Mercury and Venus. The late week will be dominated by the Jupiter-Saturn-Pluto alignment. This alignment is very close to exactitude and Jupiter’s role here should provide a boost in optimism. At the same time, there is a possibility that Jupiter may only act as an accelerator for negative sentiment and deepen the declines. I don’t think we’ll see any huge declines late in the week, but I admit it is possible. A more likely scenario is that the market will be net positive from Wednesday to Friday, with Wednesday and Friday offering somewhat more likely prospects for gains. Overall, we could well finish higher on the week although much will depend on the extent of any early week declines. If the market retraces down to SPX 1040, then the market would be lucky to finish flat, i.e. SPX 1070-1080. If we see only a minor dip on Monday and Tuesday, then I would not rule out a run-up back towards 1100.
Next week (Feb 8-12) looks like it will begin fairly positively on the Venus-Neptune conjunction but there is a good chance that losses will increase as the week progresses. The 11th and 12th look particularly bearish where a 5% decline could be possible. Mercury will oppose Mars while both planets form an alignment to Saturn and Pluto. That is likely to be another major leg down in this correction that will wipe out any potential gain we may see this week. The following week (Feb 15-19) could begin positively on the Venus-Jupiter conjunction but the Mars-Saturn aspect is near exact here and that it likely to produce at least one big down day at some point in the week. After that, the market may find a floor as the Sun-Jupiter conjunction of Feb 26th could usher in some gains in the last week of February. At this point, early March looks volatile and choppy with days that look quite positive intermingled with days that look very negative. Even if the market begins to climb again, it is unlikely to approach its recent highs again until late March or April. Even then, I would not bet on significant new highs at that time. Depending on how low we go in February, we could see 1100 emerge as a major resistance level in the months ahead. This would represent a right shoulder of a large head and shoulders pattern.
5-day outlook — bearish-neutral SPX 1050-1090
30-day outlook — bearish SPX 1000-1050
90-day outlook — bearish-neutral SPX 1000-1100
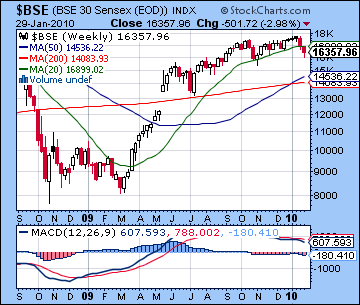
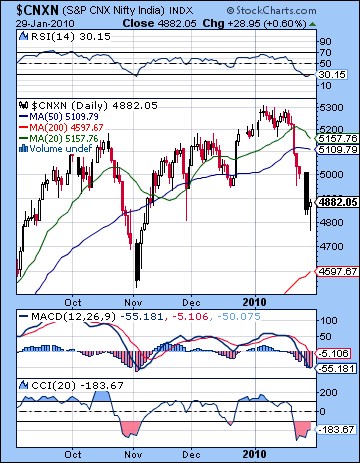 Stocks in Mumbai extended their correction last week as worries over global credit tightening compelled investors to take profits. The Sensex closed down 3% on the week to close at 16,357 while the Nifty finished at 4882. This bearish result was largely in keeping with expectations as the series of difficult Mars aspects took their toll. Monday saw prices stay relatively strong as the exalted Moon in Taurus proved sufficient to counteract some of the negativity from the Mercury-Mars aspect. Wednesday turned out to be the big down day and this coincided nicely with the Venus-Mars aspect. As predicted, Thursday saw a slight rebound as the afternoon rally off the midday lows pushed prices back into the green. Friday was somewhat puzzling, however, as the Sun-Mars opposition saw prices actually rise modestly after a very difficult start that saw stocks down 2%. As it happened, most of the bearishness from this aspect did not fully manifest until later in the day when US markets were open. So even though we only saw one major down day instead of the expected two, the retreat was mostly in line with last week’s forecast as the Nifty failed to hang on to 5000. The continued retracement offered further evidence for the notion that the market put in a significant high in mid-January with the Solar Eclipse. It’s still early days to know how long this high will stand up, but with the probability of the correction continuing into mid-February, the market will have that much further to climb in any future rally attempts. At this point, I would say there’s a 50-50 chance that the January highs will be the highs for 2010. This view assumes that the market will retreat below 4500 over the next two weeks.
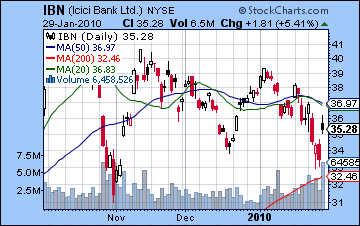
The technical picture continues to look a little shaky for Indian markets. With the RBI gently squeezing liquidity out of the market with the 75 basis point rise in CRR, a growing number of participants may begin to demand more tangible signs of economic growth and a solid earnings outlook than are currently available. So far, it seems that more bulls are deciding to take their money and run as the 20 DMA is now falling and closing in on a bearish crossover with the 50 DMA (which has also started to fall) on the Nifty chart. (N.B. Thursday’s candle is incorrectly displayed on this chart) Daily MACD is still in a negative crossover and is now deeply below the zero line reaching the same levels (-55) as were formed at the November lows. RSI at 30 is also at its worst level since November. With the RBI holding rates steady on Friday, banks saw heavy buying as shown in the ICICI chart (see IBN). It’s worth noting that volume spiked on NYSE trading, a confirming signal for the rise. However, the chart still does show much signs of breaking out of its recent doldrums as prices are still below the 50 DMA and therefore should be approached with great caution. The weekly Sensex chart is showing a negative crossover for the thirteenth week in a row as the failing momentum is becoming more deeply entrenched. Until this indicator turns positive, there is not a compelling case for taking a significant long position in the market. With the rising wedge trendline now broken, the November lows of 4500-4600 may be the most important support level. Any further declines we see this week could well test that level. I expect it should hold for the moment, although this level could be breached in the following two weeks. The 50 DMA around 5000-5100 may act as resistance here so any rally attempts to that level could run into a wave of selling which would push down prices again.
 This week looks volatile as Mercury conjoins Rahu on Wednesday and Jupiter forms an alignment with Saturn and Pluto on Friday. Generally speaking, the early part of the week looks more troublesome, although I have to admit more ambivalence than usual in ascertaining the most likely days of gains and losses. Monday could conceivably see gains as the Moon is in a wide aspect with Jupiter, although that is very much at odds with the prevailing market mood. Tuesday looks more solidly bearish as Mercury and Venus forms minor aspects with Saturn. Wednesday may well begin bearishly with the Moon-Saturn conjunction but the Mercury-Rahu influence suggests changeability so we could see a trend reversal there. We should be net negative up to the close on Tuesday and perhaps even up to the close Wednesday. But both Thursday and Friday look like decent chances for gains as Jupiter’s influence should be felt. Friday is probably the more bullish day of the two as the Moon is in Libra. In addition, both Mercury and Venus will be in very favourable places with respect to the NSE chart so that offers additional support to the view that the late week should see more buying. Overall, there is a good chance we could see the market finish at or even above current levels by Friday.
 Next week (Feb 8-12) looks more thoroughly negative again with mixed sentiment in the early to midweek period and a more negative mood prevailing on the 11th and 12th. The Mercury-Mars opposition at the end of the week has the potential for significant losses which could bring stocks nearer to a near term low. The following week (Feb 15-19) features a minor but exact aspect between a bearish Mars and Saturn and a bullish Venus-Jupiter conjunction. These influences point to mixed sentiment but with a more positive bias. The last week of February looks more bullish as a Sun-Jupiter conjunction will likely restore some measure of optimism. This looks very much like a rebound rally after a significant correction so some daily moves could be sizable. The market could retain a largely positive bias going into March and the conjunctions of Mercury-Jupiter and Venus-Uranus. The second half of March looks like weakness will return as Sun and Mercury will come under Saturn’s influence. Assuming we get a reasonably deep pullback in early February, the most likely scenario is that the rally from mid-February to mid-March will not equal the January highs. The failure of prices to match previous highs may in fact spark the round of selling that is likely in mid-March and after. At this point, April looks mixed at best.
5-day outlook — neutral-bullish NIFTY 4700-5000
30-day outlook — bearish-neutral NIFTY 4600-4900
90-day outlook — bearish NIFTY 4300-4700
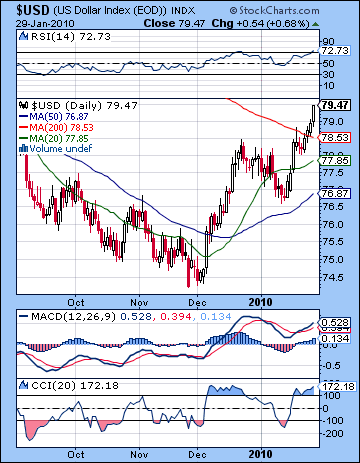 As risk aversion returned to financial markets on Greek default fears, the Dollar again took flight closing near 79.5 in the USDX chart. This bullish outcome unfolded mostly according to expectations as the persistent Mars influence upset complacency and had more investors seeking safe havens. I was correct in isolating the early week period as more negative for the Dollar and in fact it suffered its only red day on Monday as transiting Mars opposed natal Jupiter. It then rose on four straight sessions with the biggest rise occurring on Friday and the Sun-Mars aspect. I had wondered if it would make it to 79, and it actually surpassed that target. Technically, it is still "all systems go" for the Dollar here as Friday’s close was higher than the 20 DMA, the 50 DMA and even the 200 DMA. Daily MACD is again in a bullish crossover and RSI at 72 is moving into the overbought zone. CCI at +172 is showing a strongly bullish momentum and an extended period in the bullish zone over +100. For its part, the weekly chart also features a widening bullish MACD crossover and this augurs well for the medium term trend. The Dollar may begin to run into more significant resistance around 80-81, however, as this would correspond to the interregnum of last summer’s sideways move. Support could likely be found in the rising channel off the December lows around 78. This would also correspond to the 200 DMA.
This week looks more mixed as early week gains may be tempered by late week profit taking. We could see an interim low put in as soon as Monday as the transiting Venus forms a helpful aspect with the natal ascendant in the USDX chart. Tuesday could also be quite positive as the Moon-Saturn conjunction may increase investor anxiety. Wednesday’s Mercury-Rahu conjunction could go either way but with the Sun forming a nice aspect with natal Mercury, we could see the Dollar stay fairly strong. As Jupiter’s aspect to Saturn and Pluto builds into Friday, however, I would not be surprised to see some retreat. A decline back towards 78 is quite possible here. The Dollar seems likely to retain its upward momentum until at least Feb 16 and the Venus-Jupiter conjunction. After that, we should expect a consolidation phase and perhaps a 50% retracement off the recent lows. If we see a high of 80-81 here, that would mean an interim early March low around 77. Another significant rally will ensue in early March as Mercury-Jupiter conjunction will occur in a favourable place in the natal chart. Watch for a big move up on Monday, March 8th. At the same time, the Mars Direct station on March 10 will be in close aspect with the natal Saturn, so the first half of March is definitely vulnerable to significant pullbacks. There will be something of an astrological tug-of-war between a very positive aspect from Jupiter to the natal Moon and a very negative aspect from Mars to Saturn. The safest bet would be to expect sideways consolidation near the interim lows.
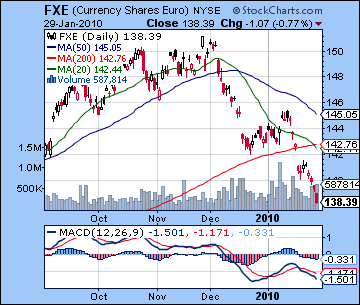 As fears grew of a Greek default and a full-fledged EU crisis, the Euro continued its decline as it closed below 1.39. This result was in line with expectations as the Mars aspects did not mesh well with the Euro horoscope. It is fascinating to watch the slow unravelling of the Euro here as the malefic Saturn-Pluto square is finally creating the kinds of severe problems I have long expected. Not only is the currency falling sharply in value, but the increasingly untenable situation with several peripheral EU economies like Greece underlines just how boxed in the ECB is in trying to deal with such varied national balance sheets. The technicals on the chart are awful now as the Euro has fallen through the 200 DMA is it now sits at a critical support level. If it fails to hold up here, it may fall to 1.35 and after that, perhaps 1.30. This week offers some hope that it could stabilize after testing 1.38 early in the week. I would not be surprised to see a net positive week here as the late week period will feature both Mercury and Venus forming aspects to the natal Jupiter. Next week looks more bearish as Mercury will come under the aspect of natal Saturn. The medium term outlook is very negative as retrograde Saturn will back up to the natal ascendant over the next three months. There is a very real possibility that the 2008 lows of 1.25 will be tested by May. I would not be surprised to see it breach those levels at some point. Parity with the Dollar is also not out of the question during 2010. The Rupee was mostly unchanged last week as it closed at 46.3. It should have a negative bias over the next two weeks with sell-offs above 47 more likely.
Dollar
5-day outlook — bearish-neutral
30-day outlook — neutral-bullish
90-day outlook — bullish
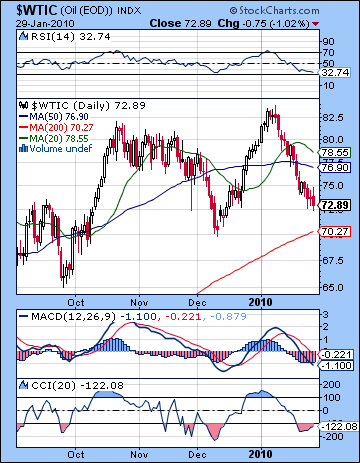 With growing doubts about the economic recovery, crude oil slipped further last week closing below $73 on the Futures contract. This negative outcome was in keeping with expectations as the Mars aspects were bearish for commodities. I was also correct in highlighting the possibility for gains in the early week as crude managed a modest gain Monday above $75 before falling on all four subsequent trading sessions. The largest declines of the week corresponded with the closest Mars aspects as Wednesday featured Venus-Mars and Friday Sun-Mars. Despite the decline, the technical picture for crude was little changed. Prices are now well below both 20 and 50 DMA. We have not yet seen a crossover in the 20 and 50 DMA, however, so that is one possible ray of hope. We saw a deep crossover in December that was not indicative of an immediate decline but another crossover coming so quickly after the first may well point to a larger pullback. Daily MACD is still in a negative crossover, however, and it is now fallen below the zero line. RSI at 32 now matches its December lows. Bulls are hoping that the previous low of $70 will provide support in this correction since it would keep intact the notion of progressively higher lows. Resistance may be fairly close to the 50 DMA at 76-77, which would also represent a 50% retracement from the highs at $82 and the $70 level.
This week crude may test that $70 level in the early going as transiting Mercury sits on the malefic 8th house cusp in the Futures chart. We could see a change in sentiment starting on Wednesday as the Moon forms a positive aspect with Jupiter. At the same time, both Mercury and Venus will be approaching aspects with Uranus so that should also boost prices somewhat. Friday is also noteworthy by the close Jupiter aspect with Saturn and Pluto so that is another potentially positive influence. One has to be extra cautious in assigning market direction to aspects from such slow moving planets since the day of their exact aspect often correlates to a loss of energy and decline. Nonetheless the co-presence of other positive factors suggests that crude could end higher overall, perhaps in the $74-76 range. The short term outlook looks fairly mixed. We may see $70 hold up here as the low for February although that is very uncertain. More weakness is likely in March.
5-day outlook — neutral-bullish
30-day outlook — neutral
90-day outlook — bearish-neutral
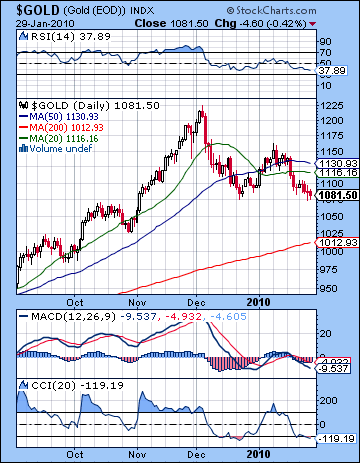 As the Dollar continued its upward ascent, gold slipped another 1% last week to close at $1081. This outcome was mostly in line with last week’s forecast although the extent of the decline was fairly muted. I had thought that $1080 might not hold and the potential double bottom pattern would be broken. However, that was not the case as enough gold bulls piled in to keep the dream alive. Prices remain well below the 20 and 50 DMA although safely above the 200 DMA at $1012. Daily MACD is still in a negative crossover and is now below the zero line. RSI at 37 is also bearish and is matching lows seen in December. CCI at -119 indicates a possible extended bear run here as it has been below the -100 line for the second week. The weekly MACD chart still shows a negative crossover and is another sign that the correction in gold is likely not yet over. While the bulls valiant stand at $1080 was impressive last week, they will be hard pressed to repeat the feat over the coming days. Any close below $1080 would likely spark a sell-off to the rising trendline around $1050. After that the $1000 level will have a lot of psychological significance and should also bring in many buyers.
This week is something of a puzzle with some potentially offsetting aspects. The minor aspects involving Mercury, Venus and Saturn in the early week should see a further decline although I would note an important artifact in the GLD natal chart. On Monday and Tuesday, Venus will be conjunct the Moon and this normally boosts prices. However, transiting Saturn also is making a fairly close minor aspect to the Moon so that may end up reversing the net effect of the Venus-Moon aspect. I would lean towards a negative outcome here, but it should nonetheless by noted that there is a large asterisk by that prediction. Later in the week could see positive sentiment return as Jupiter makes an aspect to both Saturn and Pluto. Friday looks like the best day of the week as Mercury will approach an aspect with Uranus. Overall, this week is hard to call although I would lean towards a negative outcome. If Monday is positive, however, then the week may well end up positive. A positive close Monday would increase the likelihood that the double bottom was holding (at least temporarily) and allow the bulls to run up prices once again. Next week looks more negative again, so if $1080 support hasn’t been broken, then there is a better chance it will fall then. Gold looks mixed for February with a negative bias, although some rebound is likely towards the end of the month. We could see a significant low put in at the end of March or beginning of April.
5-day outlook — bearish-neutral
30-day outlook — bearish-neutral
90-day outlook — bearish