

- Equities mostly bearish, especially early
- Dollar rally likely to get another boost
- Gold will continue to weaken, perhaps sharply
- Crude oil subject to declines
- Equities mostly bearish, especially early
- Dollar rally likely to get another boost
- Gold will continue to weaken, perhaps sharply
- Crude oil subject to declines
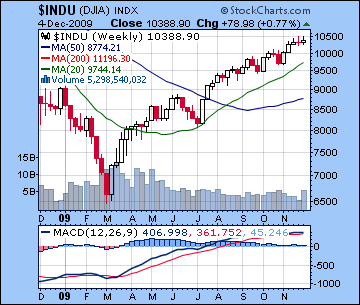
As the Dollar received a much needed shot of B12 on the better than expected jobs numbers Friday, stocks ended 1% higher as investors were encouraged by the prospect of an early economic recovery. After the Dow traded as high as 10,500 on three separate days, it closed at 10,388 while the S&P finished at 1105. My vision for more late week selling was not quite realized, although Thursday’s decline and Friday’s failure to hold onto early gains were nonetheless edifying. Mercury’s bullish influence moved prices higher as expected early on as Monday’s modest gain coincided with the Mercury-Uranus aspect. The Moon-Jupiter aspect towards the close even delivered some forecast buying on cue. Last week I had suggested that Tuesday would be a more solid up day on the Moon-Venus influence and that in fact was the case as stocks rose over 1%. I was also correct in predicting the biggest gains of the day would occur near the open when the Moon-Venus aspect was at its closest. After that, the market failed to close much higher as three successive intraday rallies got bogged down before stocks meandered lower by Friday. This outcome was also largely in keeping with expectations since we thought Wednesday might be a transitional sort of day given the Full Moon, the Neptune ingress and the Uranus station. Thursday was down as forecast as the Gemini Moon accentuated the bearish Saturn-Pluto influence. The real stain on last week’s forecast then was Friday. I had expected more selling as a result of the Venus-Saturn aspect and the Mars-Saturn pattern, but the market actually finished moderately higher. While much of the early gains were lost by the close, this bullish outcome was still puzzling. One possible explanation is that the Gemini Moon became less malefic once it had passed its exact aspect with Pluto and Saturn.
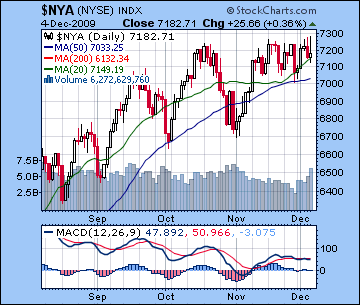
Bulls may have taken some solace in the new intraday highs of 1118 on the S&P, but the inability to reach the 50% retracement level of 1120-1125 on three different attempts ought to give them pause. Both the S&P and the Dow are no further ahead than they were two weeks ago, and the divergences between the broader averages are still intact. The NYSE Composite (See $NYA chart) is perhaps the strongest of the wider indexes and it shows a less than inspiring double top pattern with the October highs. Bulls may also note that momentum is still on their side since the 20 and 50 DMA are still rising and are nowhere near a crossover. This is quite true but last week’s volume boost without a corresponding price rise would appear to signal that some larger moves are in store in the near future. Given that most of the volume increase came on Friday’s up day, it’s conceivable that the market is preparing to move higher. But the other side of the coin is that much of that volume came after the high for the day was reached around 10 a.m after which the market beat a hasty retreat. MACD on the S&P still looks more bearish than anything else with more slightly negative histograms here and than obvious bearish divergence staring us in the face. RSI at 56 is still bullish but its trending lower and thereby adds to the falling line of peaks across the range of recent market highs. The weekly Dow chart offers slightly more support for the bulls since MACD is still positive at least but it’s flat as a pancake and dangerously close to curling over. Support is fairly significant around the 50 DMA at 1080 which roughly corresponds to the bottom trendline of the rising wedge pattern from the March lows. After that, 1020-1030 may be another level where more buyers would come in since that corresponds to the previous lows. Beyond that, 880-920 might also attract more buyers should the market be hit with a significant sell-off. Resistance is building around SPX 1120 (the 50% retracement level from Oct 2007 highs to March 2009 lows). This is also fairly close to the falling trendline from the descending market tops from October 2007. Any closes significantly above 1120 would therefore boost the bullish case enormously, but at this point, I don’t see it happening.
 The real story this week, however, occurred Friday with the huge dollar rally as hopes were raised for for a quicker recovery. With the hint of growth now closer than ever, investors anticipated rate hikes may be just around the corner and this sparked a move back into the Dollar. This was a potential signal for a major sea change since it is the first time in a long while that dollar strength has occurred for any reason other than a flight to quality. Besides knocking the air out of commodities and gold, the Dollar boost here could well accelerate a significant stock correction since its continued appreciation would jeopardize the carry trade that has underwritten much of the gains in equities over the past several months. It is perhaps fitting that this change could coincide with Wednesday’s Uranus station since Uranus is the planet of sudden changes and unpredictable behavior. I have recently noted in the "Currencies" section of this newsletter how the specific placement of the Uranus station could well indicate changes in the prevailing trend in the Euro and the Dollar. Friday’s move would offer some tentative confirmation that the forward motion of Uranus could see the Dollar in a new rising trend. It is perhaps ironic that continued positive economic data might well jeopardize stock prices in the near term since it will force many large institutional players to unwind their USD carry trades. But anything is possible in an asset bubble environment. By way of a follow up, I should also note that the difficult planets for Obama around Dec 1 did not pertain to Dubai, but rather his announcement for adding another 30,000 troops for Afghanistan. Although it was not relevant to financial markets, he has come under significant criticism from both sides over this deployment and in that way, the difficult symbolism of that planetary combination was reflected in the reception for this announcement. His chart remains under significant stress in the coming days of the Mercury-Pluto conjunction and indeed over the next three months as Saturn is parked in a tense aspect to his natal Venus through February.
The planets this week favour the bears as the early week Mercury-Pluto conjunction ought to provide enough pessimism to counteract any optimism from the approaching Jupiter-Neptune conjunction. Although Mercury will have moved slightly past its exact conjunction with Pluto on Monday, it will still be very close to the square with Saturn so that should cast a negative light on Monday’s session. There is a potential for a major down day (or two) here, perhaps 5% or more. While this week seems negative, I am a little reluctant to declare the rally over, however, since the Jupiter-Neptune conjunction is so close (just two degrees and two weeks away on Dec 21). Investors need to realize that there is still a reservoir of positive energy available for bulls to tap into which could fuel some buying, even if it turns out to be merely a bounce after the sell-off. If Monday is down big, then a midday reversal is possible on Tuesday. Wednesday seems more negative again as the Moon enters Virgo and applies to a conjunction with Saturn. The close seems more bearish than the open. Thursday will see a Sun-Mars trine that ought to be positive and Friday may also begin positively on the Moon-Jupiter aspect but it is less clear if it remains that way by the close. Even allowing for one or two up days here, the negative energy of the Mercury-Pluto conjunction seems likely to test support at 1080. We could very easily fall far below that, but given the resiliency of the market of late, we cannot rule out the possibility of a more modest decline to 1080 and then back to 1100-1120 by early next week. If we don’t move down sharply (>5%) early this week on the Mercury-Pluto conjunction, then we could test resistance at 1120 next week.
 Next week (Dec 14-18) will likely begin very bullishly on the Sun-Jupiter-Neptune pattern and this may carry over into Tuesday as well. Even if the enthusiasm fades somewhat through the week, this looks to be a generally positive week. The following week (Dec 21-25) looks negative again as Mercury slows down ahead of its retrograde station in conjunction with Rahu and in a harmonic aspect with newly retrograde Mars. Once Jupiter has passed by Neptune on December 21, we may see optimism for economic recovery undergo a change, either in quantity or quality. Perhaps hope will simply drain away soon after the conjunction as more observers will note the "half-empty" reality the US faces. Or "recovery" will be a term that encompasses a new meaning apart from asset bubbles and a naive yearning to return to the status quo ante. Much of this Obama rally since March has coincided with the Jupiter-Neptune conjunction so its culmination in the near future is another reason to question the sustainability of the equity rally. The prospect of a Dollar rally offers a intriguing new interpretation of the effect of this optimistic pairing, namely, that optimism about the economy may spark a move back into the dollar which will then end the carry trade and take stocks and commodities lower. In this sense, the optimism does not apply across the board but rather to different economic realms. The bearish Saturn-Pluto square and upcoming Mars retrograde cycle that begins on December 20 could therefore apply to an imminent decline in stocks, as well as seeding new areas of conflict both politically and geopolitically. In any event, even if we get a "run-up" in confidence over the recovery in the next two weeks on more encouraging economic data, optimism in any form could be in a shorter supply after Dec 21. We could see an interim low put in during the last week of December around the Venus-Pluto conjunction on the 28/29. January doesn’t seem very bullish either, and we could well see lower lows then around the Saturn station on January 13th.
5-day outlook — bearish SPX 1050-1080
30-day outlook — bearish SPX 950-1000
90-day outlook — bearish SPX 1000-1100
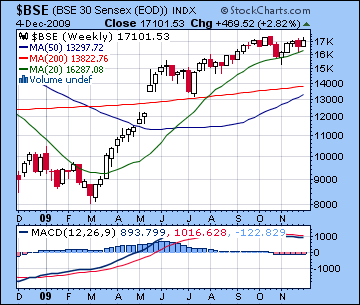
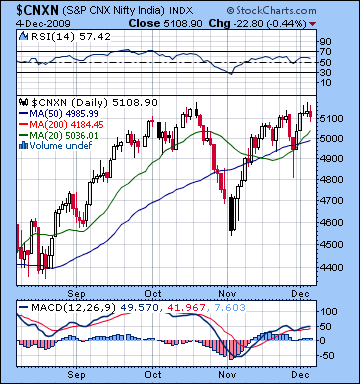 Stocks in Mumbai added 3% last week as positive economic data for September underlined the case for recovery and fears over Dubai faded into the background. With most of the gains occurring early week on the auspicious Mercury influence, the Nifty closed at 5108 while the Sensex finished at 17,101. I had expected a more bearish outcome overall although the forecast intraweek trends were largely on the mark as strength eventually gave away to weakness. Monday was up on the Mercury-Uranus aspect as the potential negative influence of the Aries Moon was limited to some late day profit taking. Tuesday was also higher on the twin influences of Mercury-Neptune and Moon-Venus. As expected, this was the biggest gain of the week. I thought that Wednesday could mark a potential turning point in market direction on the Full Moon, the Uranus station and the Neptune ingress into Aquarius. While we didn’t see a major moves down after that, stocks tended towards the negative for the rest of the week as the indices bumped up against resistance levels. I was also correct in choosing Friday as the more bearish of the Thursday/Friday pairing as Venus fell under the influence of Saturn. Overall, the run-up back towards resistance levels is testimony to the return of optimism from the approaching Jupiter-Neptune conjunction. The Mercury aspects played a role in triggering that positive energy last week and we saw the upside outweigh the fallout from the negative Saturn-Pluto aspect. Even as we come closer to the dangerous Mars retrograde cycle on 20 December, it is important to remember that this pool of optimism from the Jupiter-Neptune can be drawn upon through triggering transits over the next two weeks. This week upcoming will be a critical test of the relative importance of these competing influences as the bearishness of Saturn-Pluto will be highlighted by passing Mercury.
Technically, Indian markets seem to be in a middling position as the failure to break above resistance at Nifty 5200 weighs on the market. For the bulls, the 20 DMA has once again had a bullish crossover the 50 DMA and both are now rising suggesting that some new momentum has been gained in the past week. MACD also had a bullish crossover although the bearish divergence remains very much in play as this recent peak is at a much lower level than October’s. And while RSI is bullish at 57, that, too, shows a bearish divergence from October’s high. The weekly BSE chart remains stuck in bearish crossover pattern in MACD. This bodes poorly for prospects of new highs. So while technicals have improved somewhat over last week, until the market trades over 5200 and resistance is broken, the market may regress again towards support levels. Depending on what kind of decline we see this week, 4800 would see some buyers come in and after that 4500-4600. With some gains probable leading up to the Jupiter-Neptune conjunction on 21 December, we could be range bound between 4800 and 5200 until that date. That would be the most likely scenario. Another possibility is a deeper sell-off this week on the Mercury-Saturn-Pluto combination below 4800 and then a rebound up to 4800-4900 that fails to equal these highs here. The market would then decline after that going into the New Year.
 This week looks mostly bearish as the Mercury-Saturn-Pluto alignment forms on Monday and Tuesday. This aspect has the potential to take prices down sharply. Monday could begin higher on the Moon-Jupiter aspect but selling may increase as the day progresses. Tuesday looks somewhat more bearish although prices could rebound towards the close. Wednesday could go either way, although I would lean towards a positive open that may be enough to stay in the green by the close. Thursday seems more bearish as the Moon conjoins Saturn and triggers the Saturn-Pluto square. Previous combinations of these three planets have resulted in 1% declines so that outcome is also possible here. I would note, however, that sentiment may improve during the afternoon as the Moon moves away from Saturn. Friday sees the Sun in a minor aspect with Mars. This fiery combination symbolizes intense energy and assertive action although it could move markets in either direction. I would lean towards a positive result here although I would not be surprised by any outcome. Mars is currently debilitated in Cancer so any aspect it makes with another planet has the potential to be troublesome. If the early week Mercury affliction produces a decline, then the week should be lower overall. If for some reason we do not see a significant decline Monday or Tuesday, then that is a signal that stocks will stay strong through to next week (Dec 14-18). It would also increase the likelihood for new highs for the year above 5200. I don’t think that is the most likely scenario but it is certainly possible.
 Next week (Dec 14-18) looks more bullish as the Sun-Jupiter-Neptune alignment should begin the week favourably. This combination has the potential to push up prices significantly (>3%), especially since the Sun will conjoin the ascendant in the NSE chart. If we see a big pullback this week, then this could be a classic case of a rebound rally off a low that attempts to recapture a previous high but ultimately fails. If we don’t see a big pullback this week, then the market could easily stretch above 5200 here. The rest of the week looks only moderately bullish with Thursday the 17th looking the most bearish. The following week (Dec 21-25) could begin positively on the Venus-Jupiter aspect Monday but the bears will likely take over after that. Tuesday the 21st and Thursday the 24th may be the most bearish days here as Mercury suffers a double affliction from Mars and Rahu. The last week of December should continue the retracement down as the Venus-Saturn-Pluto alignment has the potential for another significant decline on the 28th or, most likely, the 29th. It’s possible this may mark an interim low in the correction, but there is a good chance for even lower prices into January as Saturn prepares to go retrograde on the 13th. A reasonable target would be 4000 on the Nifty by January.
5-day outlook — bearish NIFTY 4800-5000
30-day outlook — bearish NIFTY 4000-4300
90-day outlook — bearish NIFTY 4500-5000
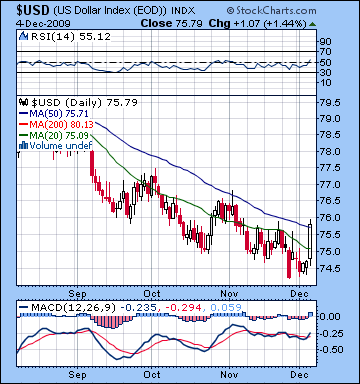 Amidst growing signs of a recovery, the US Dollar awoke from its long slumber on Friday as it rose almost 1.5% before closing near 76. Happily, I was bullish in last week’s newsletter as the late week aspect involving Venus and Saturn finally shook up markets sufficiently to once again make the Dollar a viable asset class. The week did not begin very well, however, as the Venus-Sun conjunction did not generate any buying as it closed flat. Tuesday’s decline fell in line with expectations as the interplay between transiting Venus and the natal Saturn in the USDX chart pushed it down towards support below 74.5. I was correct in noting that Tuesday would be the most bearish day of the week. And the late week gains also arrived more or less on cue as the modest increases Wednesday and Thursday were followed by Friday’s moonshot. While I may have been correct in the forecast, what was unexpected was that the rise came on good economic news and the prospect of rate hikes in the near future rather than the usual bad news and safe haven status. In any event, the possibility of a major short squeeze on the Dollar looms large in the days and weeks ahead. As a result, we could see an explosive move to the upside. The technical situation has improved since last week although the Dollar is now sitting on its 50 DMA — a key resistance level. It’s still possible that it could fall back here in the near term before taking another run, presumably after the Mars retrograde cycle on December 20. The more likely scenario is that it moves higher this week with some lesser correction next week followed by further gains as we move into January. Another indicator standing on the cusp is the RSI, now bullish finally at 55, and at the same level as a previous false breakout in early November. While further price rises would see it break above 55, it nonetheless remains in a bullish divergence as lower prices have corresponded with similar RSI levels. MACD is in the early stages of a bullish crossover and continues to add more evidence for a bullish divergence. So while promising, the technical picture is still hazier than one would like in calling for a breakout rally.
This week still looks bullish as the Mercury-Pluto conjunction in the early week period is likely to reflect a growing distaste for equities with the Dollar as the main beneficiary. The Mercury aspect doesn’t hit anything in the USDX chart but there is a very important conjunction of the Sun with the natal ascendant at 22 Scorpio. This is most exact on Monday although still very close on Tuesday. I’m interpreting the Sun as positive here, partially due to its rulership of the 10th house in this chart signifying fame and recognition. Whenever the Sun crosses the ascendant of a chart, the person or entity enjoys some notoriety and fame. It should be the Dollar’s time in the spotlight. It’s conceivable that it could be in the spotlight for the wrong reason (like a collapse!) but that seems quite unlikely given what just transpired on Friday. The most probable outcome is another big up day, and it could well be bigger than Friday’s. I would not be surprised to see a gain of 2-3% in the early week. I expect to see some weakness in the later part of the week on the Sun-Mars trine. So far it seems we are leaning towards the conservative scenario I outlined last week since the Dollar has yet to go over 76. If the gains occur as forecast, however, then 78 is quite possible here, perhaps with a dip back to 76-77 next week. Even in that conservative outlook, we could see 80 by the end of the December with 82 by mid-January. A more bullish scenario would put it around 85 by January.
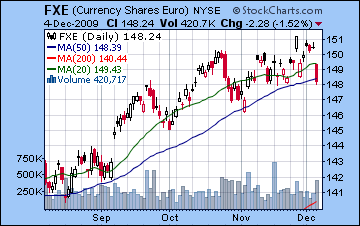 After trading above 1.51 earlier last week, the Euro closed down at 1.487. Last week’s forecast was right on the money not only because it was bearish but always for identifying Friday as a problem given Mercury’s placement on the 4th house cusp near Pluto in the natal chart of the Euro. (Jan 1 1999, 00.00). We can also gain considerable information from price action before and after the Uranus station on Wednesday at 28 Aquarius in conjunction with the natal Jupiter. The Euro posted fresh highs early in the week when Uranus was still moving in retrograde motion, aided by the positive Mercury aspects. Sentiment turned negative once Uranus changed its direction and began to move forward from Wedneday on. Now that Uranus is moving away from bullish Jupiter, there is all the more reason to expect we have just witnessed a major change in trend. While the Euro may still see significant up days, the floor of support from the Uranus influence on Jupiter will be less likely in evidence. Technically, the Euro is poised right at its 50 DMA so in that respect it is mirroring the USD quite closely. The Euro has traded near its 50 DMA on several occasions during the rally since March but has rebounded higher each time. Any move significantly below that support — currently at 1.48 — would spark a wave of selling. We could well see it early this week. I am expecting at least one or maybe two bounce days later on that may mitigate the losses. Monday December 14th should see a very large rise as the Sun forms an aspect with natal Jupiter. That whole week could be very positive depending on the kind of influence that Jupiter exerts on natal Ketu. This is sometimes a difficult combination so it’s possible that the Euro sells off again after the big rise on Monday. On balance, I would still expect more in the way of an extended rise that week. The last two weeks of December look quite negative so we could see the 1.40 support level tested by then. The Rupee was mostly unchanged this week after trading at 46 on Thursday. It, too, was caught in Friday’s headlong rush to the Dollar. With more Dollar strength this week, the Rupee could trade over 47 once again.
Dollar
5-day outlook — bullish
30-day outlook — bullish
90-day outlook — bullish
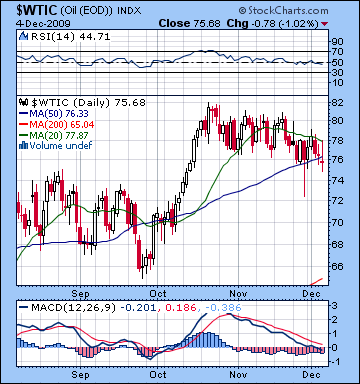 Despite the improved economic outlook in the US, crude oil continued its uninspired performance of late as it moved lower before closing Friday below $76. I was bearish here so this result provided solid confirmation, especially given the two up days early in the week on the Mercury aspects. I had forecast "one or two up days", although I thought they would most likely be Tuesday and Wednesday instead of Monday and Tuesday. Monday’s gain came despite the Moon’s transit of the 12th house in the Futures chart, but nonetheless quietly confirmed my suspicions that the bearish case on Monday was a little thinner than I would have liked. As predicted, the late week period was negative although the largest decline actually occurred Wednesday. The technicals on crude remain as bearish as ever as MACD is still in a bearish crossover and falling. To make matters worse, it is now in the negative zone. RSI at 44 is now in the bearish zone and follows a fairly bleak downward sloping line. Previous lows reversed around 40-45, so it’s possible it may get some support near here. If it doesn’t, then it could fall quite quickly. On the bright side, there has yet to be a bearish crossover of the 20 and 50 DMA, although the 20 DMA is pointing down. The current price sits right at the 50 DMA and should be seen as a pivotal level. More downward movement would may not generate buying until the next support level, perhaps closer to $70-72 and then the 200 DMA at $66.
This week looks quite bearish as the Mercury-Pluto conjunction at 8 Sagittarius will set up under the aspect of the natal Saturn at 9 Libra. This could create a significant move down on Monday and Tuesday, perhaps close to the $70 support level. We should expect some mid to late week bounce as Venus will conjoin the natal Jupiter-Uranus conjunction on Wednesday through Friday. While I doubt all three days will be higher, we could definitely see two positive days. Wednesday and Thursday would appear to be the most likely candidates as the Moon activates Neptune and the natal ascendant early on Wednesday (but beware of weakness later) and frames the Venus aspect on Thursday. Thursday may be the better of the two days. Friday could go either way although the open seems more positive than the close. Given the proximity of the Jupiter-Neptune conjunction and the aspect it makes to the ascendant, we should see a significant rally next week Unless this week is an absolute disaster and it falls below $66, I would not be surprised to see crude trading above $76 by December 18 or 21 and would not even rule out $80. After that, it should track lower into January, with a possible interim low around the 13th and the Saturn retrograde station. This date will have the added bearish influence of the Sun-Venus conjunction that takes place close to the malefic 8th house cusp in the Futures chart.
5-day outlook — bearish
30-day outlook — bearish
90-day outlook — bearish-neutral
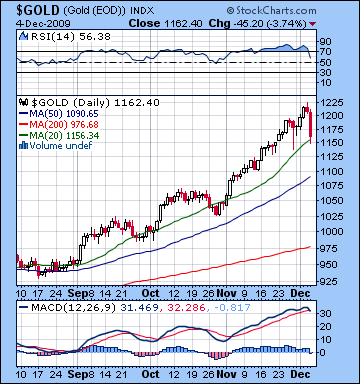 After such a crazy week, it seems anti-climatic to note that gold futures fell only 1% last week before closing at $1162. As they say, it’s more about the journey than the destination. The negative outcome was largely in keeping with last week’s forecast, although I underestimated the early week strength. I had thought Monday would be a down day but after some intraday weakness, buyers came in before the close to keep things more or less as they were. As predicted, Tuesday and Wednesday saw gains on the Sun and Venus aspects as gold pushed above $1200. Actually it made a high of $1227 on Thursday before closing moderately lower on the day. In last week’s newsletter I noted how the Gemini Moon might create a "negative mood around gold" late in the week. An understatement to say the least, as gold plunged $60 on Friday’s Dollar rally. The extent of the decline has stained the previously unblemished technical picture as MACD now sports the beginnings of a bearish crossover. RSI is still in the bullish zone at 56 but it has come down from the stratosphere around 80. Friday’s decline bounced off the 20 DMA around $1155, so it’s conceivable that that level could act as support going forward. With such a parabolic move up, however, picking out support may not be much better than throwing darts. The 50 DMA may also bring in buyers at $1090. Gold’s recent rally bears a strong resemblance to crude oil’s speculative rally in 2008 and that ended suddenly and precipitously. We could well see something similar here with gold. If we get more positive economic news coming out of the US in the days ahead, a rate hike will become more likely and that will increase the move into the US dollar and out of all other asset classes. This is especially true for gold which has benefited the most from the Dollar decline and the carry trade.
This week looks like an extension of Friday’s bearishness — at least in the early going. Admittedly, the Mercury-Saturn-Pluto configuration does not directly afflict anything in the GLD natal chart so that is one absent indicator that makes the bearish case a little weaker. Nonetheless, transiting Mars (24 Cancer) is now moving slower than ever and is hammering away at the natal Moon (24 Capricorn). While its slow velocity allows Mars to do more damage, it also makes it harder to pinpoint the time of its maximum effect. Friday’s decline was partially the handiwork of Mars but it’s unclear just how long the bad vibes can continue. I think that Monday and Tuesday could see more selling, with another possible big down day like we saw on Friday. Thursday stands out as a bullish day ahead of the Sun-Mars trine aspect and it could extend into the beginning of Friday. Wednesday may also be bullish although perhaps less so. So it’s possible we could test the 50 DMA at $1090 this week (although that does seem a bit extreme) but the rebound towards the end of the week will likely take us back over $1100. Next week looks bullish so we should expect a significant rally. I would not rule out any levels here as the rally should be quite strong. Gold will likely peak again on December 21 and the Venus-Jupiter aspect after which it will start to decline once again. This peak will probably be lower than the Dec 3 high of $1227 although I can’t be certain. The more likely scenario is that it attempts another run-up to $1227 but tops out around $1160-1200 and then heads lower. In any event, most of the move down in gold will occur from late December through February. So how low can it go? I think the decline in gold is going to shock a lot of people (especially those owning gold!) and we could see prices fall below $1000 before the end of December with $900 possible by February, and maybe lower. There’s considerable support around $800 so that may be a longer term level to keep an eye on.
5-day outlook — bearish
30-day outlook — bearish
90-day outlook — bearish