

- Stocks trending lower but with possible early strength
- Dollar to strengthen through the week
- After possible early gains, Gold likely to fall to $1100
- Crude oil to fall towards $70
- Stocks trending lower but with possible early strength
- Dollar to strengthen through the week
- After possible early gains, Gold likely to fall to $1100
- Crude oil to fall towards $70
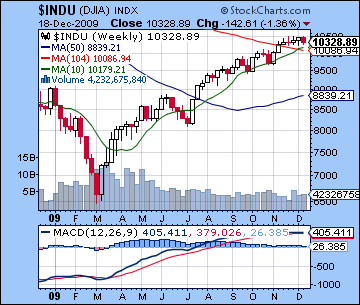
After a reasonably enthusiastic start, stocks went back into cautious mode last week as not even Bernanke’s promise of low interest rates was enough to coax buyers out of their holiday torpor. Key resistance levels held firm through the week as the Dow closed Friday down slightly at 10,328 while the S&P ended at 1102. This end result was more or less in keeping with last week’s forecast of gains early followed by weakness with a neutral to downward bias overall. The biggest surprise was the weakness of the rally on the Sun-Jupiter aspect. While the market made several attempts back to resistance levels of 1120 on the S&P, it never really made a convincing case. Monday was predictably higher as the Sun (vitality) approached Jupiter (confidence) but gains were quite modest in the end, another sign that the end may be nigh for this rally. I had been somewhat less bullish on Tuesday although still fairly uncertain and stocks sank. Wednesday’s New Moon was singled out as a possible trend reversal day and indeed that seemed to mark the last attempt to match recent highs of SPX 1120 as the market closed mostly unchanged on the day. I thought that we would see more negativity manifest later in the week and indeed my guess of Thursday was correct as we slipped back to 1090. Friday saw a modest recovery on the approach of the Venus-Jupiter sextile as stocks struggled to make it back to Monday’s starting point. Overall, it was another week of indecision as more investors seemed uncertain about the future. Stocks may well be caught in a no-win situation here as simmering fears of more sovereign defaults is matched by the equally unpalatable prospect of higher interest rates and the end to the Dollar carry trade.
The technicals are little changed from last week as the current narrow trading range has not altered any basic patterns. Momentum remains plausibly strong as prices match their 20 DMA and are still above their 50 DMA which now stands at 1088. While the inability to puncture through resistance at 1120 may be seen as a sign of weakness, it’s important to note that support has been impressive as this week’s low was higher than last week’s. Volume was up slightly this week, especially Friday, but it is still in line with previous trends. RSI at 52 remains slightly bullish but there is no mistaking the negative divergence of the recent cascade of falling peaks. Daily MACD has been negative since late November and is also characterized by a negative divergence that is associated with slowing momentum and an eventual reversal. Nonetheless, MACD is still in positive territory so it’s conceivable that the erosion of momentum could last a while longer before any significant correction occurs. We can find a somewhat more bullish picture in the weekly Dow chart. Despite obvious signs of flattening in the MACD averages, it is still net positive. From a longer term view, the absence of a clear bearish crossover in the weekly chart may be a bullish technical signal. While broader averages have already crossed over in their weekly MACD charts, the Dow may well be the last man standing in that regard. And as expected, the RSI peaked very near 70 early this week and faded back to close at 64. While this is not a significant divergence, it is nonetheless an interesting artifact of the recent rally. If the market turns lower here as we think it will, then 70 will end up as the high water mark. In keeping with recent trends towards a narrowing of the rally, the NYSE Composite closed at its 50 DMA, a somewhat lower perch than the blue chip indexes. If stocks make another rally attempt, they will likely confront the 1120 level once again. The more times it fails to penetrate 1120, the stronger the resistance becomes so the technical picture would offer some evidence of a move lower and a test of support at 1080. If it falls through that, the previous low of 1040 may attract some buyers and then the 990-1000 level.
 As noted above, the market seems to be stuck in the middle. Fears of more bad assets and debt defaults can still rattle markets and push investors to the safety of the Dollar. On the other hand, growing confidence in a recovery seems to be boosting the Dollar and thus spelling trouble for stocks purchased through the Dollar carry trade. For the Dollar, it’s an enviable case of "heads I win, tails you lose." The Dollar continued its recent winning streak last week and this seems likely to be the dominant currency trend in the weeks to come. In Wednesday’s Fed meeting, Bernanke vowed to continue to rates down for the near term in order to spur job growth, but the bond market seems to think that he will be forced to raise rates sooner rather than later as yields have crept higher. The draining of liquidity from the system began last week with reverse repos and is slated to continue over the next several weeks. This may force up the Dollar further and put pressure on the carry trade. The implications for stocks and commodities are unlikely to be positive. I note that the horoscope of the Federal Reserve (Dec 23, 1913) will be undergoing major affliction over the next several weeks. While it is possible this may be related to internal organizational matters that may not affect the market, it is an additional piece of evidence that offers some support to the general notion that there are difficulties ahead for financial markets.
This week looks very busy in terms of planetary aspects. The high number of aspects in play here may increase volatility and also mark the start (and finish) of significant medium term trends. Mars turns retrograde on Sunday followed by the Jupiter-Neptune conjunction on Monday. Neither of these is particularly positive, although Venus does form a supporting sextile aspect to Jupiter on Monday early. The planetary situation is made even more bearish by Mercury’s minor aspect to Mars, just as Mercury is about to conjoin Rahu and then go retrograde. With all these close aspects, we will have another chance for a significant down move both this week and next. Previous negative patterns have not lived up to their billing, so we need to be fairly cautious about managing any extravagant downside expectations. Still, the astrological potential is there and should be reckoned with. If Monday starts higher, it may well finish in the red as the Moon enters Aquarius. Tuesday could see a snapback rally but that is anything but certain. If Monday closes higher, then Tuesday would more likely see profit taking. Wednesday may be positive as Mercury conjoins Rahu while the Moon forms a potentially supportive aspect near midday in late Aquarius. Thursday will be a short trading day ahead of the Christmas holiday but it may well be negative as the Pisces Moon opposes Saturn in Virgo. Overall, the market should be lower this week, perhaps significantly. Support at 1080 may be tested.
 Next week (Dec 28-Jan 1) looks like another negative week as Venus forms an aspect with the Saturn-Pluto square that could see a sharp sell-off on Monday or perhaps Tuesday. The latter part of the week is also troubled by retrograde Mercury again coming in contact with the minor aspect of Mars. This could see a break of another significant support level. The following week (Jan 4-8) looks to begin bearishly as Monday the 4th features a conjunction between Sun and retrograde Mercury. This is the same conjunction that occurred on Obama’s inauguration day when the market fell 3%. Not to say that history repeats, but it does sometime rhyme. A rebound is likely midweek but I am concerned that the late week minor aspect between Mars and the conjunction of the Sun and Venus could see more selling. After that we can see a possible reversal point on Jan 11 and the Sun-Venus-Rahu conjunction which occurs just two days ahead of the Saturn retrograde station. If the market has been in correction mode until then as I expect, then this could be a possible interim bottom.
5-day outlook — bearish SPX 1050-1080
30-day outlook — bearish SPX 950-1020
90-day outlook — neutral-bearish 1000-1100
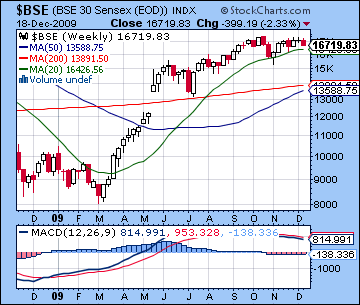
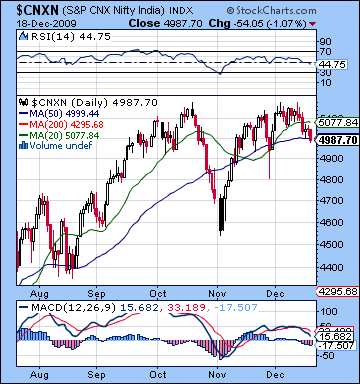 Stocks in Mumbai moved lower last week as inflation worries increased the prospect of interest rate hikes. The Nifty slipped back below the 5000 level before closing at 4987 while the Sensex finished at 16,719. I had expected more bullishness on the early week Sun-Jupiter aspect but optimism mostly faded after some intraday strength on Monday. Tuesday’s decline was showed the after effects of the Sun-Jupiter aspect as the market weakened throughout the day. The inability of the market to find any strength early on precluded the possibility of any advance last week as the late week dynamics more or less followed bearish expectations. Wednesday’s New Moon in Sagittarius was mostly unchanged as the Moon-Venus aspect offered only limited support. Thursday was another day without much direction as the worst of the Moon-Pluto was tempered by more positive sentiment towards the close. The decline I had expected for Wed-Thurs actually showed up in Friday’s session as the Moon-Mercury aspect did not produce any significant buying. Overall, a disappointing week in terms of my forecast although the negative direction was not entirely unexpected given some of the prevailing planetary energies and difficult technical position of the market. The failure of the bulls to make any headway on the positive Sun-Jupiter aspect is nonetheless a useful clue about the vulnerability of the market going forward.
The technicals look increasingly precarious for this market. While the Nifty remains trapped in a fairly narrow trading range within the rising wedge pattern, its close below the psychological support level of 5000 is not bullish in the near term. It closed below its 20 DMA and very close to its 50 DMA, a potentially significant level of support. The bulls may take some comfort in the fact that the 20 DMA is still above the 50 DMA so momentum remains on balance positive. However, MACD presents quite a different story as last week’s action has created a negative crossover, while the bearish divergence of falling peaks is still very much evident in the MACD landscape. The recent high water mark around 50 would make for a very low peak from which MACD could trend still lower, with an entry into negative territory now more likely than ever. RSI at 44 tells a similar story as it has entered the bearish zone and is still features a negative divergence of falling peaks. With recent Nifty highs corresponding to just 60 here, the RSI would appear to be poised to go lower. The Sensex weekly chart shows a fairly clear topping pattern with MACD now negative for the eighth week in a row. This sign of faltering momentum correlates to the fact that the Sensex has not managed to break above its mid-October highs despite repeated attempts. Resistance levels become more impregnable the more times the market fails to break above them. It would seem that Indian stock indices are forming a bearish double top pattern that could presage a larger move down. If the market does make a significant move down as I expect, then it may find some buyers at the 4800-4900 level which would roughly correspond to the bottom trendline of the rising wedge pattern. Below that, 4500-4600 as the previous significant low may figure prominently in any pullback and consolidation.
 The planets this week generally look more difficult with the greater chance of larger declines. There is certainly no shortage of troubling aspects as short and medium measurements appear to be working in syncopation at this time. Mars turns retrograde on Sunday ahead of the market open and could well mark the beginning of a significant worsening of sentiment. Jupiter and Neptune finally make their final conjunction in the first degree of Aquarius on Monday as both the Moon and Venus punctuate the alignment with their benefic energy. While this pattern consists of entirely positive planets, there is good reason to suspect that it marks the end of a period of relative optimism. More specifically, we could see some strength here, especially early on Monday but I would be very cautious about any rallies. We are just as likely to sell-off hard once the aspect begins to separate, either by the close or perhaps by Tuesday. In addition, Mercury forms a minor aspect with Mars on Monday and given Mars’ current state of debilitation, this influence on Mercury, the planet of trading and commerce, would appear to add another layer of bearishness. The high density of aspects in the early week would therefore increase the likelihood of some sizable moves this week, probably on the downside. The simultaneity of these aspects also may serve as important touchstones for the prevailing trends as we move into 2010. I believe the most likely scenario is that this week will mark the end of this current rally before we head lower. It is also possible that this week would usher in a new phase of protracted choppiness of mostly sideways movement. The rest of the week is dominated by Mercury’s approach to Rahu which comes exact on Thursday. In favourable market conditions, this could be seen as a bullish aspect as increased volume and exaggerated expectations might push up prices. But the sky seems more malefic here so the Rahu influence is more likely to act as another drag on the market. Besides the possibility of early strength Monday, Wednesday could be positive as the Moon transits between Jupiter and Uranus, although there are problems likely later in the day as the Moon comes under the transit of Mars. Thursday looks more bearish as the Moon enters Pisces opposite Saturn. Overall, the market should be down this week, perhaps significantly.
 Next week (Dec 28-Jan 1) will only have three trading days due to holidays, but it also looks problematic as Mercury, now retrograde, once again conjoins Rahu while Venus conjoins Pluto. This again raises the possibility for large losses, especially on Tuesday. Some midweek bounce is likely here as the Moon transits Taurus, but Thursday seems vulnerable again as Mercury forms a minor aspect with Mars once again. The following week (Jan 4-8) is likely to begin bearishly as the Sun conjoins retrograde Mercury in Sagittarius. The Sun then conjoins Venus later in the week which might suggest some improvement in sentiment but since it occurs in aspect with Mars, I am reluctant to call for any significant recovery. If anything, this may push the market lower still. After that, both Mercury and Saturn will change their directions in mid-January and that may well mark the end this period of correction and consolidation. The latter part of January and February appear to be more positive as Jupiter (confidence) approaches a minor aspect with Pluto (corporations). That said, I do not expect this rebound rally to set the world on fire. Depending on how low we go in the next few weeks, the market may not be able to match recent highs for some months yet. At this point, I expect a retracement move back to 4000-4500 by mid-January, followed by some tentative rally attempts in the second half of January with a somewhat more convincing rally in February.
5-day outlook — bearish NIFTY 4800-5000
30-day outlook — bearish NIFTY 4300-4700
90-day outlook — bearish-neutral NIFTY 4500-5000
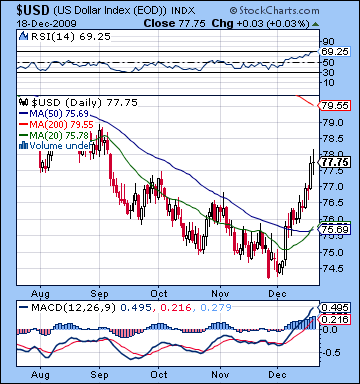 The Dollar continued its winning ways last week despite encountering some putatively troublesome aspects and closed a little under 78. My, how times have changed. I had been more bearish on the expectation that early week strength might be offset by late week selling but as it happened Friday was merely flat. Monday was lower ahead of the Sun-Jupiter aspect but Tuesday’s Venus aspect came through as predicted with a substantial again. I had expected a split between Wednesday and Thursday and that indeed was what we got as Wednesday was slightly lower and Thursday was higher. Nonetheless, I underestimated the upside here as the negative Mars effects were no match for Venus’ proximity to the ascendant. The fact that the Dollar could end up flat on Friday on a difficult Moon-Mercury aspect is testimony to how the medium term aspects have shifted. Saturn has moved off its discouraging aspect to the Sun and is now more favourably placed at the Midheaven. The technical picture continues to shine brightly here as momentum is building for an extended rally. While the previous week saw a close above the key resistance level of the 50 DMA near 76, this week’s gain added an exclamation point to the break out as Monday’s drift back towards that former resistance level was overturned with Tuesday’s gain. So we have all the makings of the classic situation where a former resistance level may now be acting as support going forward. Adding to the momentum story we see that the 20 DMA is poised for a bullish crossover of the 50 DMA as both are trending higher. MACD is in a sharply bullish crossover and is now in positive territory. RSI at 69 is climbing higher also and seems destined to move into overbought territory in the near term. There could be a fair amount of resistance around 78 since it matches much of the August price action. This week is likely to test those levels with more gains in offing if not this week, then next week.
This week has more upside potential as the beginning of the Mars retrograde cycle on Sunday may stoke risk fears and fuel a move back to the Dollar. Nonetheless, some early week declines are possible on either Monday or Tuesday as the Sun forms a minor aspect with the natal Saturn. I still think these two days should be net positive but one down day could be part of the package. Wednesday seems hard to call, although I would lean towards a positive outcome if only because that has been the trend of late. Thursday seems more emphatically positive as transiting Venus forms a minor aspect with the natal Sun. Overall, we should be somewhat higher although next week seems to be a safer bet for gains as the Venus-Pluto aspect looks quite tense for financial markets and should produce more safe haven buying in the Dollar. The strong rally is likely to continue until early January and then may taper off a bit but will probably still stay intact. February may see a temporary correction, however, as the Jupiter-Pluto aspect is likely to generate more optimism for equities.
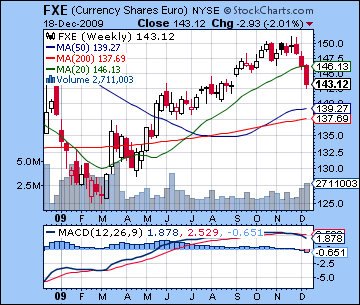 The Euro continued its retracement last week as it closed near 1.43, down over 2%. This result was far more bearish than expected as the favourable Sun-Jupiter aspect early in the week generated very little in the way of buyers. Once this aspect was out of the way, the widespread selling of the Euro picked up steam and it fell through the rest of week. Thursday’s difficult Moon-Pluto was predictably bearish, but Friday was even worse as the negative effects of the Saturn-Pluto square slowly accumulate and weigh on this chart. The weekly Euro ETF chart (FXE) shows how much the technical condition of the Euro was weakened lately. Prices have fallen through the 20 WMA (and the 50 DMA) and MACD has now turned negative. Given that this weekly MACD reading has been positive since March, this bearish crossover may be highly significant and indicate lower prices over the medium term. This week does not provide much in the way of relief as Mercury falls under the aspect of natal Mars while Sun conjoins the IC near Pluto. While Monday has the potential for an up day — and maybe a big one — with Venus aspecting natal Moon, it is hard to optimistic about the Euro here. One possible bullish scenario would see a modest gain this week fueled by Jupiter’s aspect to the Moon. Jupiter’s approaching aspect last week may have been short-circuited by its conjunction with Ketu so now that it has moved past it, Jupiter could be in a better position to deliver some positive energy. This scenario seems less probable, although given the extent of the recent sell-off, I would not be surprised to see more of a rebound before trending lower. The Rupee moved lower last week, briefly trading below 47 before settling at 46.9. I was far too optimistic last week as the Dollar continued its revival without interruption. While this week is something of a toss-up, I expect more weakness over the next two weeks, perhaps back to 48.
Dollar
5-day outlook — bullish
30-day outlook — bullish
90-day outlook — bullish
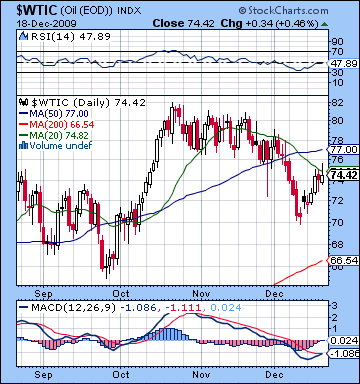 Crude oil shook off its recent doldrums last week and rose over 6% before closing above $74 on the continuous contract. This was largely in keeping with expectations as the Sun-Jupiter aspect brought back buyers. I had forecast a significant gain on Monday/Tuesday and despite Monday’s tepid performance, Tuesday saw a sizable rise. Wednesday’s gain was more of a surprise as the New Moon in the first degree of Sagittarius was enough to activate the natal Mars in the Futures chart. Thursday was down as expected on the Venus-Mars trine and Friday’s rise was similarly in line with our forecast. While crude did not quite make it back up to its 50 DMA, it came fairly close. As it happens, current prices sit more tentatively atop the 20 DMA but this hardly amounts to an endorsement of any budding rebound rally. MACD remains negative although it is poised to make a bullish crossover. We can also distinguish a bearish divergence in MACD as levels are much lower than September’s trough although crude is still trading at higher prices. MACD on a weekly basis was negative for the second week in a row, which is more evidence that the medium term trend may have turned bearish. RSI at 47 is improving but it would have to rise above 55 to break with the series of falling peaks. There is likely a fair amount of resistance at $76-77 and it seems unlikely that crude can break above that level here. $77 may be of particular significance since it represents both the 50 DMA and the 50% retracement from the previous week’s lows. Support may be quite firm around $66 as that not only coincides with the previous low but also now with the 200 DMA.
This week looks mixed as the Venus-Jupiter aspect on Monday may produce gains while sellers will likely predominate later in the week. If the Venus-Jupiter aspect was the only close aspect in the sky, then we could more confidently expect a rise on Monday or Tuesday. The difficulty here is that Mars turns retrograde while in a tense aspect with Mercury at the same time so this muddies the waters considerably. I still think a rise is the most likely scenario for Monday, although that is not at all certain. Tuesday may be more negative as Venus forms an aspect with the natal Mars in the Futures chart. Wednesday and Thursday seem more likely to produce selling as the Sun approaching Pluto and will thereby fall under the malefic aspect of natal Saturn. Transiting Venus will also be under pressure through its conjunction with natal Ketu. So even if we see a rise early, we should see a decline overall this week. Crude may fall further over the coming weeks as Mercury turns retrograde very close to the 8th house cusp in the Futures chart. I expect the down trend to extend at least into the first week of January. After that, we could see a rebound in the second half of January and into February.
5-day outlook — bearish
30-day outlook — bearish
90-day outlook — bearish-neutral
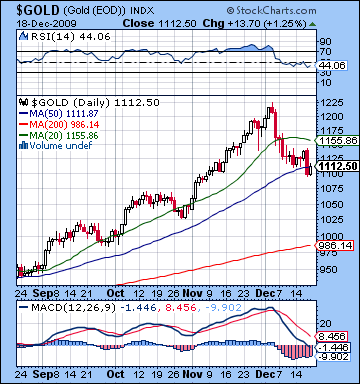 As inflation fears re-emerged last week, gold stanched most of the bleeding as prices ended up only slightly lower closing at $1112. While I had been more bullish on the potential of the Sun-Jupiter aspect in the early going, the intraweek dynamics actually weren’t far off the mark. Monday’s modest gain was followed by a flat day Tuesday but they were net positve as expected. Wednesday was also higher as the anticipated Venus influence came in on cue. And in keeping with expectations, Thursday and Friday were net negative as Thursday’s decline outweighed Friday’s comeback. So even if gold didn’t come anywhere near $1150, it nonetheless bounced off $1100 and closed at its 50 DMA. And given the Dollar’s continued revival, gold’s relative stability last week ought to be somewhat heartening for gold bulls. But the technical picture is deteriorating for gold as MACD is still in a huge bearish crossover and RSI stands at 44. One could make the case that the RSI is forming a potentially bullish double bottom, but it’s not really much for the bulls to go on. The weekly MACD is still positive so that is another consoling piece of evidence for the bulls. It remains to be seen, however, if renewed inflation fears will be enough to move gold higher again. The further appreciation of the Dollar seems very likely and this is going to have a depressing effect on gold, irrespective of any prospects for economic recovery and subsequent inflation. One would think that the best case scenario for gold would be more sideways movement as inflationary expectations are largely offset by the end of the Dollar driven carry trade. A more realistic scenario, however, is that gold moves lower.
This week looks like a return to negativity for gold as the Mars retrograde period will probably increase risk aversion and send investors back to the Dollar. There is nonetheless a good chance for gains early in the week, especially Monday on the Venus-Jupiter aspect. As an added plus factor, this will coincide with the Sun’s conjunction with the ascendant in the GLD ETF chart. The rest of the week looks more bearish, however, as the Sun approaches Pluto on Thursday. So we could see a decent rise Monday perhaps back to $1130-1140, then declines predominating for the rest of the week with $1100 as a possible end point. With next week also looking generally bearish on the Sun-Pluto aspect, we could well see $1000 by early January. While some sporadic rallies are likely in the early months of 2010, the overall trend is down until at least March.
5-day outlook — bearish
30-day outlook — bearish
90-day outlook — bearish