

- Possible big move down early in the week followed by a partial rebound
- Dollar trending higher
- Gold vulnerable to declines early, with chance for snap back rally later
- Crude headed lower, perhaps below $65
- Possible big move down early in the week followed by a partial rebound
- Dollar trending higher
- Gold vulnerable to declines early, with chance for snap back rally later
- Crude headed lower, perhaps below $65
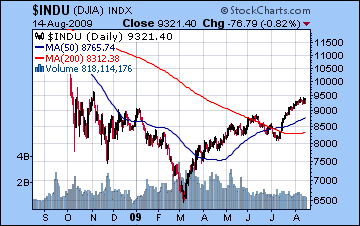
Stocks in New York ended slightly lower last week as mixed economic signals offered tempted both bulls and bears. With Friday’s decline wrapping up a see-saw week, the Dow ended down just 0.5% at 9321 and the S&P at 1004. Generally speaking, the week unfolded more or less according to forecast as the early week was marked by selling on the Mars-Saturn aspect followed by strength on the Sun-Mars-Jupiter alignment. I had been unsure just what kind of sell off we might see Monday and Tuesday and I opened the door to a possible larger scale pullback but that did not occur as the market only fell 2%. With the possibility of a major decline out of the way, this allowed for the market to once again test those November 2008 resistance levels of SPX 1010 and this is exactly what happened Wednesday and Thursday. I had been fairly tentative about Wednesday’s chances for a gain but definitely allowed for the possibility of a rebound to begin then and last into Thursday. Indeed, stocks retested 1012 each day with Thursday’s close being the higher of the two. As predicted, Friday saw a pullback as the Sun-Mars-Jupiter began to separate although the late day rally off the lows gave some hope to bulls.
So while we did in fact trade above SPX 1010/Dow 9400, it wasn’t by very much and the failure to punch above that resistance level should be seen as a bearish sign. It’s conceivable that there will be a final attempt to close above it this week, although given the planetary picture that lies ahead, I’m fairly doubtful we will see it. From a technical perspective, volume fell significantly last week, a possible sign that caution is now in growing supply as enthusiasm for stocks wanes. And while both the 200 and 50 DMA continue to rise, the shorter term averages in MACD have begun to move down, as have the histograms. RSI remains high although it has begun to retreat towards the mean. Overall, those technical factors give some support to the notion that we’re at the top here. In last week’s newsletter, I thought there was a 50-50 chance we’d already seen the top and with the failure of the market to break much above, I’d say the chances are now 75% that we’re past the peak of this rally. That still holds out the possibility of a final run up this week, although the prospects for that look increasingly dim.
 With no less than two almost simultaneous multi-planet aspects this week, we could see some big price moves here, especially early on. First, Mercury will conjoin Saturn on Monday during the trading day. This is ordinarily a bearish indicator anyway but here it has an important added ingredient: it will be exactly 150 degrees from Jupiter. This is generally a difficult aspect and although Jupiter is a bullish planet, Jupiter-Saturn combinations are usually unfavourable. To complicate this picture somewhat, the Moon will be approaching a conjunction with benefic Venus, especially in Monday afternoon. This is a bullish factor which introduces an ambiguity into the predominantly bearish Mercury-Jupiter-Saturn combination. While I think the net effect of these planets will be negative, there is a chance that we could see a final push higher Monday intraday before going lower. Now if that weren’t enough, there is a second multi-planet pattern that will be in play Monday and especially Tuesday. The Sun (1 Leo), Mars (1 Gemini), Uranus (1 Pisces), and Neptune (1 Aquarius) will form a very rare geometric alignment in the sky. This is arguably neither bullish nor bearish, but it still can be interpreted as an important event for the market and may be another signal of a major turning point in sentiment. Given the mostly bearish pattern with Mercury and Saturn, this Sun-Mars aspect may provide additional fuel and therefore increases the chance we’ll see a fairly sizable move. If he we head down as I think we might, it could be on the order of 3-5% or perhaps even more. This pattern bears a resemblance to some of the big one day drops we had in September and October last year so investors should be prepared for all possibilities. If for some reason, however, the bullish Moon-Venus takes control (admittedly this is less likely), then the upside would be somewhat smaller. Tuesday morning (at the open) may be a time of confusion and uncertainty as the Moon conjoins Ketu so this may indicate a lower open and a probable down day. If the market falls as expected through Monday and Tuesday, then Wednesday has a good chance for a gain as Venus moves into a minor aspect with Jupiter. Wednesday’s close may be particularly strong as the Moon applies to Jupiter. Thursday also looks fairly positive as Mercury opposes Uranus while the Moon conjoins the Sun in Leo for the New Moon. Friday could go either way, although I would lean towards the negative, especially in the afternoon as the Moon will conjoin Saturn. If we fall hard in the early week, then it is unlikely that any recovery late week will bring the market back to current levels. So overall I am making the case for a bearish week here.
Next week (Aug 24-28) begins very ominously with Mercury forming a tense t-square with malefics Mars and Pluto starting on Monday and continuing into Wednesday. This pattern has the potential to take the market down sharply, perhaps up to 5% if the negative trend has already been established. Wednesday is a possible reversal day as Venus conjoins Ketu in good aspect with the Moon, especially in the afternoon. The late week period generally looks positive as Mercury and Mars will enter into aspect with benefic Venus. Even with malefic Mars sullying the mix, there is good reason to expect the Venus factor to bring the markets back from the dead. It’s hard to say if the rebound will be enough to counteract the early week slaughter, but it may give bulls hope that all is not lost. The following week (Aug 31 – Sep 4) may well begin negatively again as Mercury will form a square with Mars. Since Mercury will be slowing ahead of its retrograde cycle (beginning September 7), any afflictions to it will be even more bearish. This seems like another down week that may well see the market testing its July lows of SPX 880/Dow 8200. We could see a significant bounce (e.g. 5-10%) in the second week of September (Sept 7-11) but there seems to be more bearish patterns after that as the Sun will conjoin Saturn just as it lines up opposite Uranus in mid-September. Looking further ahead, I think we won’t see the lows until at least October, with a possible retest of the lows in November. In terms of levels, 800/7500 is very possible here, and we may well fall below that. Watch for another deluded hope rally starting in December as Jupiter will again be moving forward (recall that it changes its direction October 13) and will again team up with illusory Neptune to create the optimism needed to believe in yet another version of this fairy tale recovery.
5-day outlook — bearish
30-day outlook — bearish
90-day outlook — bearish
1-year outlook — bearish
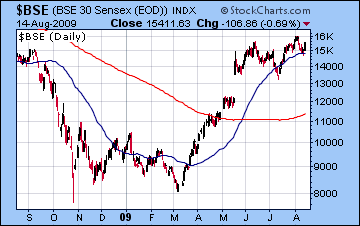
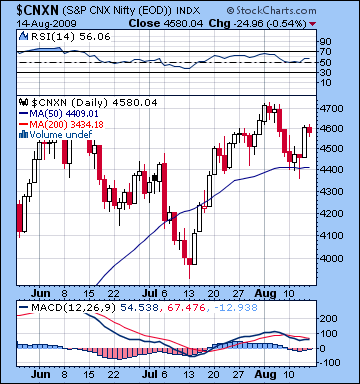 Stocks in Mumbai added almost 2% last week as recovery hopes outweighed continuing drought worries. After bouncing off 4400 Wednesday, the Nifty closed at 4580 while the Sensex finished Friday’s lacklustre session at 15,411. This mildly bullish outcome was more or less in keeping with expectations since I had suggested that we would see more weakness early in the week on the Mars-Saturn aspect. Interestingly, Monday’s downside was relatively minor — perhaps a sign that much of the negative energy had already manifested the previous Friday. I had allowed for this possibility and this made the bullish scenario for the week a more likely outcome. Wednesday’s midday decline to 4400 was also foreseen to some extent as I predicted that some kind of decline was possible Wednesday or perhaps Thursday on the Sun-Saturn aspect. As an indicator of the building bullish energy for the Sun-Mars-Jupiter aspect, however, the market rallied strongly Wednesday afternoon and continued into Thursday with a big 3% gain. While I was mistaken in calling for a big up day Friday, it nevertheless arrived late in the week and in that way confirmed the relevance of the planetary geometry. Overall, my interpretation of the astrological influences was somewhat reflected the market’s movement.
As expected, the market did not break above its June highs (4700) and remains in a possible topping pattern at these levels. RSI is mildly bullish at 56 while MACD is still in a negative crossover pattern. Perhaps more noteworthy is the current position of the 50 DMA with respect to the market. Currently at 4409, the 50 DMA provided support for prices earlier in the week as the market rallied above it. But this moving average has finally stopped rising after a three month incline and has now flattened out. If it turns down and the market trades below it, it will give more courage to the bears to take more risks on the downside. This is all the more likely since the market is at the back end of a bearish double top pattern. If we break below the 4400 level here, the Nifty may get to 4000 pretty fast. Given all the negative planetary energy out there in the coming weeks, this is likely to happen very soon indeed.
 This week features two very intense and powerful multi-planet alignments that have the potential to take markets down sharply. On Monday, enterprising Mercury will conjoin pessimistic Saturn at 27 degrees of Leo. While this is a bearish influence, it is complicated somewhat by the fact that both planets will be in a 150-degree aspect with benefic Jupiter. Although Jupiter is a bullish influence, the presence of Saturn in any larger pattern usually (but not always) carries the day, and the market declines. Additionally, the Moon will conjoin Venus in the sign of Gemini which is often associated with trading. This combination of auspicious planets is often a bullish signal but its occurrence on this day is likely to be overwhelmed by the Mercury-Jupiter-Saturn negativity. As if that weren’t enough, the early week period also features a very unusual four-planet alignment between Sun (1 Leo), Mars (1 Gemini), Uranus (1 Pisces) and Neptune (1 Aquarius). Even if the Sun-Neptune opposition is considered difficult, this four-planet pattern may be seen as an accelerator rather than purely positive or negative. It increases the available energy for the the other planets and increases the chance for: 1) a large price move (>3%) and 2) a turning point in the rally. Although I cannot be 100% certain of the direction of this move, I believe the movement will be down. It certainly is a lot of planetary energy, and it’s conceivable that we could go higher before selling off in the aftermath of the alignment. Nonetheless, my best guess is that the market corrects with a rebound Wednesday and Thursday on the Venus-Jupiter aspect. As an added positive factor, Mercury will oppose Uranus on Thursday so that is an added basis for bullishness later on in the week. The bullishness may well continue into Friday as Venus moves into aspect with Uranus. While there is a significant amount of late week positive energy, the early week seems fraught with danger so the bearish scenario seems more likely to prevail.
Next week (Aug 24-28) this leg down will really get going as there is a very afflicted pattern involving Mercury, Mars and Pluto. The presence of two malefics (Mars, Pluto) with Mercury, the planet of trading and commerce, is a frightening prospect and increases the likelihood for a big decline (5% or more) at some point between Monday and Wednesday. As a possible scenario, if we happen to break below 4400 on the Nifty this week, next week we could well be testing 4000 due to this aspect. Alternatively, if the market stays above 4500 this week (unlikely but still possible), then next week will break through 4400 with a vengeance. Gains are very likely late in the week, however, as Venus will aspect Mercury and Mars so that should give some encouragement to buyers. The following week (Aug 31 – Sep 4) also looks quite bearish as Mercury again squares Mars, as does the start of the week after as Mercury begins its retrograde cycle on 7 September. But investors should watch for a significant rally as that week progresses (Sept 7 – 11). The market looks like it will head sharply lower after that as we move into the thick of the Saturn-Uranus opposition. We appear to be moving towards an October low with a possible retesting in November. I believe that Nifty 3150/Sensex 10,500 is very much in play in this decline. I am looking for a significant rally to follow the Fall bottom perhaps beginning in December on the Jupiter-Neptune conjunction and extending into the Spring 2010.
5-day outlook — bearish
30-day outlook — bearish
90-day outlook — bearish
1-year outlook — bearish – neutral
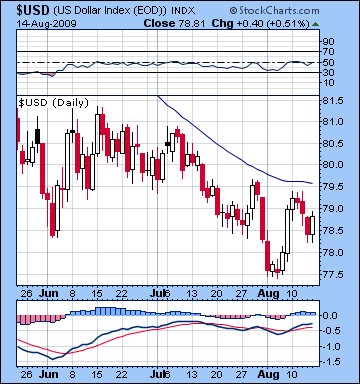 The US dollar continued to move around in the doldrums as it slipped a little last week closing under 79. This mixed result was in keeping with my admittedly broad ly-defined expectations as the dollar never seriously tested last week’s lows. Monday’s gain arrived on time with the Mars-Saturn aspect and the Sun-Jupiter aspect later in the week sent the dollar somewhat lower than anticipated. Nonetheless, the late week recovery finally showed up Friday which minimized the downside damage. The dollar appeared to narrow its trading range last week as it failed to reach last week’s high of 79.5 and similarly found support at the 78.5 level. Technically, MACD is tentatively bullish while RSI has once again ventured towards the 50 line. And while it still bearishly trades below its 50 DMA, that average is finally showing signs of levelling off. Overall, it paints a picture of a potential reversal, although without any clear indications that one is imminent. This week again looks mixed, perhaps indicative of swings in both directions. The early week is likely to see gains, possibly big gains above 80 and the 50 DMA on the Mercury-Saturn conjunction. On a cautionary note, however, the relevant natal chart does not indicate a particularly positive planetary situation that ought to correspond with an up move. This absence of a clear positive signature therefore should temper our optimism for the dollar. Later on in the week Mercury forms a minor aspect with the natal Ketu and this may lead to a substantial pullback, perhaps towards 79 again. A higher low this week would definitely mark a change in sentiment for the dollar and would indicate we are headed sharply higher in the near term. Watch for big gains the following week on the terrible Mercury-Mars-Pluto t-square. The dollar could well be trading back over 82 by that time with a possible target of 83-85 by the first week of September. We may well see 88 by October if all goes according to plan.
Last week the Euro edged higher closing above 1.42. This outcome was not unexpected although I thought we would see a little more downside on the Mars-Saturn aspect. As it happened, the Euro bounced off 1.41 and again rallied to 1.43 on the Sun-Jupiter aspect as we thought it might. 1.43 is a significant resistance level for the Euro as it corresponds both to the June high and the November 2008 high. If it fails to break through it again this week, long investors may get skittish and start to bail. This week promises to be quite important for the Euro as the Mercury-Saturn conjunction sets up right opposite the natal Jupiter and square to the Mercury. This kind of energy usually corresponds with a big move and it seems likely that it will be down. Some significant recovery is likely by the end of the week, although I believe we will end lower overall. As drought fears continued, the Indian Rupee slipped back a bit last week to close at 48.35. I don’t foresee this bearish move ending anytime soon, so we could see it move above 48.5 this week. September may well push it above 50.
Dollar
5-day outlook — neutral – bullish
30-day outlook — bullish
90-day outlook — bullish
1-year outlook — bulllish
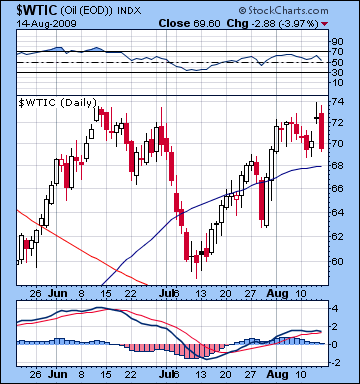 With Friday’s sharp decline, crude oil lost ground last week and closed just under $70. While I had been somewhat more bullish, this outcome was not surprising given that the intraweek moves closely mirrored the forecast. As predicted, crude moved below $70 early in the week on the Mars-Saturn square with the low for the week reached on Tuesday. It reversed more or less on cue and the Sun-Jupiter aspect that took it higher later in the week topping out above $72 on Thursday. I had expected the rally to extend into Friday, so I was wrong on that score but the decline was in keeping with our general outlook of lower prices. The inability of crude to stay near or exceed the resistance levels of $72-74 is a potential sign of weakness as repeated failures to hold this level will embolden bears and induce doubt in the bulls. MACD remains marginally positive but the lines are quickly levelling off, as is the 50 DMA. While crude still trades above its 50 DMA of $68, it is in jeopardy of falling through that level. Such a breach would be met with sharp declines towards $60 where there is more support.
This week looks fairly bearish with the Mercury-Saturn conjunction occurring near the 4th house cusp in the Futures chart Monday and Tuesday. Some bounce is likely after that but by Friday Mars applies to conjoin the natal Rahu, which could signal another potential pullback. Overall, I think we could see crude finish below its 50 DMA and perhaps closer to $65 if Friday turns out to be negative. The following week looks disastrous for crude as the Mercury-Mars-Pluto configuration sets up on Rahu-Ketu in the Futures chart. This sort of aspect has the power to push prices down by more 5% in a single day. As I have stated previously, I think we are headed for a sharp correction in crude oil prices here. Watch for the biggest decline (or even a possible bottom) around October 8-9 when Mars conjoins Ketu. This will set up exactly square the natal Mars in the Futures chart and, as fate would have it, a Mercury-Saturn conjunction will be exactly square Rahu in that chart. It’s an astonishingly bad double whammy that could absolutely crush prices 10% in a sudden and punishing single move.
5-day outlook — bearish
30-day outlook — bearish
90-day outlook — bearish
1-year outlook — bearish-neutral
 After trading at an intraweek high of $960 Thursday, gold retreated a little bit Friday to close at $948. This outcome was more bearish than forecast, although I had expected a rally to $960 this week and we did eventually make it there, however briefly. The Mars-Saturn square took gold down as expected although it never traded below $940 even at its worst. Friday’s decline was a little unexpected since I thought we wouldn’t see any big sell offs until this week. Nonetheless, with the failure of gold to match previous highs of $970, there is an increased likelihood that we are in narrowing flag or triangle pattern that will be resolved shortly with a violent break out move, presumably down. MACD has turned negative and the constituent moving averages are now similarly pointing down. Even if gold is still trading above its 50 DMA here, it is vulnerable to sharp declines if it closes below 929.
This week will likely see the move down continue although the picture is not quite as clear as one would like. While the Mercury-Saturn conjunction occurs exactly opposite the Part of Fortune (aka Punya Saham) in the ETF chart (very bearish), the natal Venus (1 Libra) may well be activated by the plethora of planets in the first degree of their respective signs — Sun, Mars, Uranus, and Neptune. Since Venus is such a benefic planet, there should be some upside to gold this week, perhaps Tuesday or Wednesday. Gold’s planetary significator, the Sun, is opposite Neptune on Monday, so that offers a plausible explanation for a down move then. Nonetheless, the picture is more mixed than I would like and may indicate that gold may just hold its own to some extent this week. Of course, a big down move is still possible in the early going, but I did want to offer my ambivalence about some of the less than persuasive measurements I am seeing. Early next week looks truly horrific for gold as the Mercury-Mars-Pluto t-square sets up on the ascendant of the ETF chart. This could easily take prices down 5-10% over a couple of days. As Ketu transits over natal Saturn, we can expect the selling of gold to continue through September and early October. Again, my conservative price target for the low would be $750, but we could well fall below $700. Let’s see how bearish Aug 24-26 period is first and then that will give us a better idea of how low gold can go.
5-day outlook — bearish
30-day outlook — bearish
90-day outlook — bearish
1-year outlook — bearish-neutral