

Summary for week of April 25 – 29
- Stocks may decline Monday but gains likely into midweek early; end of week unclear
- Dollar may be subject to more selling midweek but firm up by Friday
- Crude to rise into midweek with late week more mixed
- Gold strong into Wednesday but declines more likely by Friday
Stocks rebounded strongly last week on better than expected corporate earnings as Monday’s surprising US debt warning disappeared into the mists of memory. After trading as low as 12,100, the Dow gained more than 1% on the week closing at 12,505 while the S&P500 finished at 1337. The Dow made new highs for the year, although the S&P remains a few points shy of its February high. I thought we might have ended up somewhat lower overall, although the week did unfold more or less in line with expectations. Monday’s decline arrived on cue as Standard and Poor’s warning over the US debt shocked investors and sparked a significant selloff. This correlated quite nicely with the Mars-Saturn opposition that I noted in last week’s newsletter. Unfortunately, that was the extent of the downside for the week as Tuesday was higher despite the Mercury-Saturn aspect. Wednesday was the big up day and this fit well with the Sun-Venus-Neptune alignment which I thought might bring higher prices in the mid to late week period. So it was an impressive show by the bulls who have wrestled back control here and are poised to send the S&P to 1400 (or beyond) if they can break above the previous high of 1345.
The recent run-up has been disheartening as I had expected more downside to manifest ahead of May’s Jupiter-Rahu aspect. It now seems possible the market may continue to rise right into the aspect which is exact May 7. That is one scenario to consider at least. What is more encouraging for the bearish view, however, is that gold and crude oil are beginning to reach danger levels as far as the Fed is concerned. The Dollar took another thumping last week and now is sitting at its low from 2009. While many observers have known all along that Bernanke was going to devalue the currency in order to jump start the economy and try to inflate his way out of the debt trap, he may now be realizing that all such stimulative actions have consequences and they are not all positive for the economic recovery. If crude continues to rise, it will begin to eat away of consumer discretionary spending and will produce yet another recession. This is essentially what took place in 2008 when crude reached $147. The US economy cannot expand when its chief source of energy is on the verge of going parabolic. So Bernanke may soon be forced to make a choice: either intervene in the Dollar in order to lower gas prices and risk an unwinding of the risk trade that has marked the equities rally for the past two years, or let the Dollar fall and watch oil go back to $147 or higher and see the economy slip into recession. Both options have serious negative consequences, but it seems that the currency intervention approach at least allows for some possibility of avoiding another recession. So the Fed may well go that route and it may happen fairly soon. The Jupiter-Rahu aspect in May is one possible indicator of some kind of rethinking around the economy and the financial system as assumptions surrounding wealth and growth (Jupiter) and subject to change or confusion (Rahu). I’m not saying that some shocking rate hike is in the cards next month, but this aspect could represent some genuine re-jigging in financial markets. Bernanke may begin to talk up the Dollar, for example. We shall see.
 The bulls remained in control of the market as they defended a key support level on Monday. The rising trendline off the 2009 low was tested by Monday’s intraday low of 1295 and then buyers moved in to take it higher once again. The new high on the Dow remains to be confirmed by an SPX close above 1345 although we could only be one good day away from that outcome. Even more bullish was the emergence of an inverted head and shoulders pattern with a neckline of 1330-1340. If this pattern were to be completed, it would push the SPX to 1430. Bulls are no doubt salivating at this prospect, although it should be noted that such IHS patterns do not always play out as expected. Nonetheless, a close over 1345 would definitely give more encouragement to the bulls and would likely give the market a lift, whether or not it actually makes it to 1430. 1300 remains a key support level in the event of any pullbacks and a close below 1295 would lead to more selling.
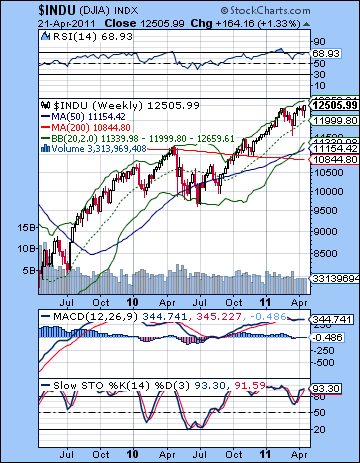
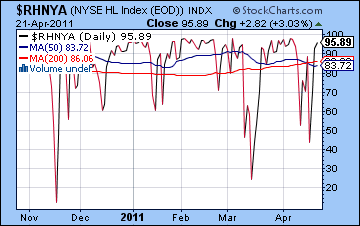
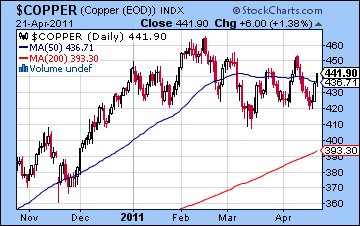
It is possible to build a case for more upside here as MACD is on the verge of a bullish crossover, although it is now in a negative divergence with respect to the previous high. Stochastics (71) have a little more room to run here so some investors will only exit long positions once it is over the 80 line. The Dow weekly chart still shows how this is a market based on momentum alone as current indicators do not paint an appealing picture for staking out new long positions. RSI is now at 68 and is pushing up against the 70 line. Of course it could go higher as it did in February, but it is also more likely to top out closer to the 70 line — in other words, just where it is right now. We can see that the 20 WMA is offering some support at 11,999 so as long as the Dow stays above that level, the strong bullish view will prevail. A weekly close below 12K would open new downside possibilities where 10,844 could be tested. Market breadth is another indicator that is suggesting the end of the rally may be nigh as the high-low index ($RHNYA) is once again over 95. Corrections usually occur when this index moves over 95, although they can be stretched for a few weeks before reversing. Meanwhile, copper continues to move mostly sideways as it closed at 441. Significantly this was below last week’s high and below the February high. It still lags behind stocks suggesting that the rally may be weakening. Treasuries stayed firm last week despite the equities rebound as the 10-year finished around 3.40%. This is perhaps the best bit of evidence for the bears as bonds continue to be bought despite last week’s debt warning. This is a sign that the market may be segmenting somewhat as bonds are pointing to lower equity prices.
 This week begins with a Mercury-Saturn opposition that could be bearish. Mercury returned to direct motion on Saturday so it will actually be moving away from Saturn by Monday. Nonetheless, it is close enough that some downside is quite possible. The midweek period could well be more bullish, however, as the Sun and Venus form a positive aspect with Pluto. This is likely to produce at least one but probably two up days going into Wednesday. The end of the week is less clear as there is an absence of any obvious aspects. If there is a clue here, it may be provided by the Moon which enters Pisces on Friday. This could energize all those other planets in Pisces (Uranus, Mars, Mercury and Jupiter) and produce a gain. So there is a greater likelihood that we finish higher this week, although if Monday is lower than it could interrupt the bullish mood. A bullish scenario would see only a modest retreat early in the week followed by a rise to new highs on the SPX by Wednesday. As depressing as that prospect is, it is certainly quite possible. Thursday could be lower but Friday may well see stocks finish on a positive note, perhaps staying above 1345. A more bearish scenario would see a deeper decline on Monday below 1325 with smaller moves in both directions after that. We would then finish somewhere between 1330-1345 after Friday’s probable gain. I tend to think there is a good chance for further bullish moves here, especially as we approach the Jupiter-Rahu aspect. Nonetheless, the medium term indications are still bearish and will eventually asset themselves in the coming weeks. I would be quite surprised to see a lot of downside this week, as I think May offers a greater likelihood for a significant sell-off.
 Next week (May 2-6) could be more eventful as both Mars and Jupiter will come under the influence of Rahu (North Lunar Node). This is likely to increase volatility although some up days are likely to be in the mix. The following week (May 9-13) also tilts bearish as Jupiter begins to separate from Rahu. This could mark some significant downside and may coincide with a break of the rising trendline and support at 1300-1310. The rest of May looks more bearish, especially the last week as Mars conjoins Venus. The bloodletting will likely extend into early June with a possible low around June 7 and the Jupiter-Neptune aspect. The other possible candidate for a reversal higher would be June 13 which coincides with Saturn returning to direct motion and the Mercury-Ketu conjunction. While I tend to favour the latter date as a potential bottom, I can’t quite see the bearishness lasting for a whole month from the first week of May to the second week of June. The correction should be at least 10% and could well be much larger than that. A rally is likely to begin in June and will probably continue well into July. This looks like a significant rally of at least 10% that may challenge any highs we get in April-May. By August, the market will begin to falter, this time perhaps with some shocking force. I would expect the year’s low to occur in the second half of the year, perhaps in September or in December. It is difficult to say how low it may go but I would definitely not rule out SPX 1000.
5-day outlook — neutral-bullish
30-day outlook — bearish
90-day outlook — bearish
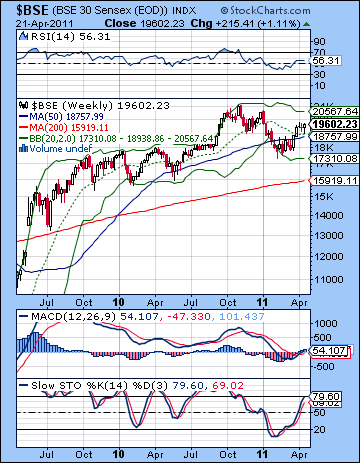
 Stocks rebounded last week as a favourable outlook on corporate earnings edged aside inflation worries. After a fairly sharp decline Monday, the Sensex rose more than 1% closing at 19,626 while the Nifty finished at 5884. While I thought we might have seen more downside, this outlook was broadly in keeping with expectations. Monday’s bearish alignment of Mercury-Mars-Saturn did correlate closely with a decline, although the market reversed higher by Tuesday’s close. As it turned out, we did test the previous week’s low of 5725, but the bulls came back taking prices higher for the rest of the week. As expected, the mood shifted by midweek as the Sun-Venus-Neptune alignment boosted sentiment through to the end of the holiday-shortened week. In the end, Thursday’s close was even higher than my bullish scenario of 5850, although not significantly so. I was not fully convinced that we would see anything too dramatic just yet on the downside and that view was borne out by the forceful rebound.
So the market continues to keep its head above water here in the wake of the big correction that dominated the first quarter of 2011. The initial correction was primarily the result of inflation and the prospect of rising interest rates that threatened to choke off economic growth. While the market has now discounted several more rate hikes this year, it is unclear is the global financial situation will continue to support higher equity prices. The problem is that the market is assuming that the Fed will continue its zero-rate policy into 2012 and pump liquidity into the system in order to keep asset prices rising. While this has been a correct assumption over the past two years, it is uncertain just how long that can last. The Fed’s largesse may finally be confronting its natural limits here as the Dollar continues to fall and crude oil experiences a concomitant rise. Rising oil prices in the US now threaten to cause inflation there and increase the likelihood of reducing economic growth as consumers divert more discretionary spending into fuel purchases. In other words, Bernanke’s chickens may be coming home to roost as the US is now experiencing what India and other emerging markets have been confronted with over of the past year. The Fed knows the current trend of rising prices and a falling currency cannot last indefinitely and it may have to intervene to arrest this inflationary spiral. The upcoming Jupiter-Rahu aspect in May is one potential astrological indicator for a change in Fed policy as wealth and growth (Jupiter) is subject to change that results in confusion or distortion of expectations (Rahu). If Bernanke is forced to defend the Dollar, it could result in a chain reaction around the world that sees a move out of risk trades and back into safety. This could mean the end of the rally in commodities and would likely weaken equity markets.
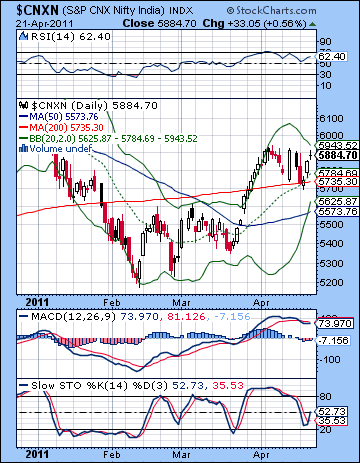
 From a technical perspective, the market is range bound here between key resistance and support levels. The bulls successfully defended the 200 DMA at 5735 on Monday’s decline and that set the stage for the rebound. In order for the bulls to take control, the Nifty must rise above 5950. Actually, there are two separate resistance levels there. The falling trend line from the November high comes in around 5900 so that will be the first test this week. A close above 5900 may bring new buyers in but they will likely still have to cross over the 5950 level which was a previous interim support level dating back to late 2010. A close above 5950 would likely begin a new bullish move higher.
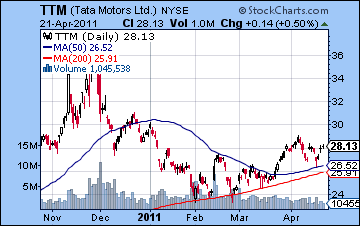
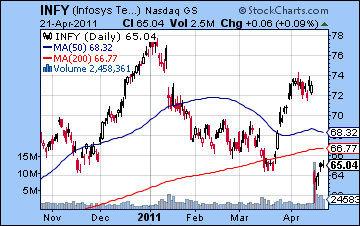
The indicators offer some evidence for the bullish view although it is still somewhat equivocal. Stochastics (52) appear to be on the rise to the 80 line so that suggests more upside is quite possible. If we do see a further rise here, it may well move past 5950 in order to get the Stochastics past the 80 line. RSI (62) is on the rise but it may be forming a series of lower peaks which would be more bearish. MACD is still in a bearish crossover and does not favour the bulls. This sets up a tug of war between bulls and bears as bulls may only want to go long after the Nifty crosses 5900-5950 while bears may short before it reaches those levels. Bears may also be waiting to short if it breaks below the 200 DMA. The weekly BSE chart shows how the bulls have kept the market above support at the 20 and 50 WMA at 18,700 and 18,900. A break below these levels and it definitely increases the possibility for a larger move lower, perhaps as far as the 200 WMA at 15,919. Stochastics (79) are getting close to overbought, however, so that may dissuade some medium term bulls from committing new money for long positions. Meanwhile, Tata Motors (TTM) continues to move sideways although it did make a successful test of support of its 50 DMA last week. It’s possible that it is forming a basing pattern here before moving higher although it would likely to have break above its early April high of 29 before that occurs. After its disastrous sell-off, Infosys (INFY) rebounded somewhat last week. It still is significantly below its 20 DMA, however, and has only clawed its way back to its March low. We will likely see shorts moving in here and in the event of a rally to the 200 DMA. A close above the 200 DMA may signal that more upside is to come.
 This week looks likely to start off bearish as Mercury opposes Saturn on Monday. Mercury returns to direct motion on Saturday and will be moving away from Saturn but the aspect will still be very close. For this reason, there is a significant probability of some early week downside. Just how much is unclear although I tend to think it could be 1-2%. By midweek, there is a reasonable chance for gains as the Sun-Venus pairing now encounter Pluto. This is likely to boost the market into Wednesday at least and I would not be surprised to see two consecutive up days on Tuesday and Wednesday. The end of the week is harder to call owing to a lack of clear aspects. Thursday could conceivably tilt bullish if only because of a potential lag effect from Pluto, but I think it is fairly unlikely that the bullish trend would continue into Friday. Friday looks more susceptible to declines, especially if the market has risen into Wednesday and Thursday. A more bullish scenario would see a modest fall Monday to only 5850 before the Nifty reversed and tested resistance into Wednesday and Thursday at 5950. It is possible that it could go over this level and create a round of short covering. Even if Friday is lower, the Nifty would still likely close higher on the week above 5900. A more bearish scenario would see a steeper fall Monday to 5800 or below following by another rally attempt to 5900 by Wednesday. The end of the week would then be more bearish to mixed with Friday closing somewhere around 5850-5900. In other words, close to current levels. I would lean towards the bullish scenario a bit more here, although both are very possible.
 Next week (May 2 – 6) looks more clearly bearish as Mars conjoins Jupiter under the disruptive influence of Rahu. Even if the Nifty may has previously broken resistance, there is good reason to expect a significant retracement lower here, probably below support levels. The following week (May 9-13) also looks like it will begin negatively so we could get a test of the 200 DMA fairly quickly. Some recovery is likely by the end of the week. The rest of May appears to tilt towards the bears, although not hugely. A bottom is possible in early June ahead of the end of the Saturn retrograde cycle. Just where the market will turn around is difficult to say. It’s possible that we could head much lower to test the February low at 5200 but it’s by no means probable. For such a large correction to occur, the Nifty would have to first convincingly break the 200 DMA. If it does so, then such a major decline is more likely. The second half of June looks more solidly bullish and the rally should continue through much of July. This rally seems unlikely to launch a major bull phase but it may be fairly strong, especially if it has been preceded by a significant sell-off to 5200 or below. August and September look more bearish again and we could well see lower lows at that time, perhaps testing old support at 4800. The end of the year also looks bearish so that might be a more prudent time to consider establishing some medium and long term long positions.
5-day outlook — neutral
30-day outlook — bearish
90-day outlook — bearish-neutral
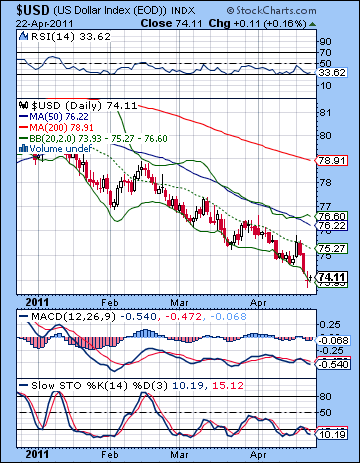 The Dollar continued to be spurned as the risk trade reduced it to a forlorn pile of ashes. Despite Monday’s rise on the US debt warning, it ended lower again closing at 74. The Euro closed higher at 1.455 and the Rupee lost ground ending the week at 44.82. I had been less than enthused about the Dollar’s chances here so this bearish result did not come as a shock. After breaking below the rising trend line off the 2007 lows earlier in the month, last week’s bearish claim to fame was matching the low from December 2009. While some support is possible here from this horizontal support line, there are many observers who feel a decline to 72 may be inevitable in the short term. I’m less convinced of that, however. The Dollar’s bearish credentials were out in force once again as Monday’s rally reversed right at the 20 DMA just as it has been doing in every rally attempt for the past four months. RSI (31) is very close to being oversold so that may act as some support in the short term. Of course, it could fall below the 30 line before recovering but it at least provides some credible possibility for reversal, especially since it is also sitting on that previous low. MACD continues to quietly flat line in negative territory while Stochastics (11) at least show some sign of bottoming out. So there is actually a semblance of a bullish case to be made here from the technicals. Of course, a convincing close below 74 this week might scupper any immediate hope for a rebound and it would hasten the test of 72. Bernanke seems intent to devalue the currency in an effort to inflate his way back to (false) prosperity. That might work for a while, but at some point if no one wants your currency, you’re in real trouble.
This week looks more hopeful for a Dollar rebound, especially in the early week period and the Mercury-Saturn opposition. It might even climb back to the 75/1.44 level before reversing lower. The midweek period looks more bearish for the Dollar, however, so it’s unclear if the gains will stick. We will therefore likely retest 74 this week. The end of the week looks bullish again so there is a good chance it will close somewhere between 74 and 75. Baby steps here, it seems. Next week looks very bullish, at least at the start. I would not be surprised to see a 1% gain here and a run at 76. The middle of the month looks more mixed but the end of May looks very bullish again. This would be a time when the Dollar was more likely to break above the falling trend line if it hasn’t yet done so. The rally should continue into June. July looks quite bearish for the Dollar so we should see some significant retracement lower at that time. Another major push higher is likely to begin in September and continue through to December at least. This is likely going to be a stronger rally than anything we see in the next couple of months. It could well be the time when the Dollar finally tests resistance at 88/1.20.
Dollar
5-day outlook — bullish
30-day outlook — bullish
90-day outlook — bullish
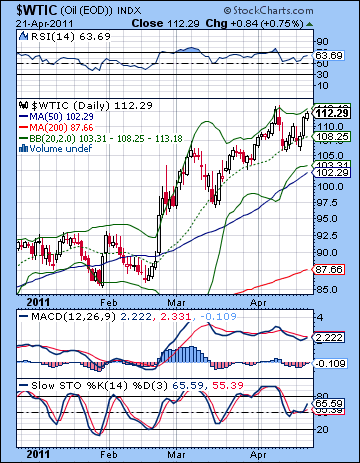 As the Dollar extended its downward spiral, more investors sought refuge in crude oil as a hedge. Crude futures rose by 2% on the week closing above $112. I thought we might get a little more downside, but the rise was not entirely unexpected. Monday and Tuesday saw weakness as expected but crude only retraced back to $106 before reversing higher. The midweek Sun-Venus-Neptune aspect delivered the upside more or less on schedule as prices rose through Thursday. Bulls remain in firm control of this market as the 20 DMA held as support in the early week. This has been the pattern since the February breakout. Bulls now have to try to break above the previous high of $113 in order to make another move higher, perhaps targeting $120. It’s getting quite close to its upper Bollinger band, however, so that may limit the enthusiasm for new long positions. RSI (63) is on the rise and may well have room to run up to the 70 line. On the other hand, there is the possibility of a series of declining peaks in the RSI so a reversal lower this week would confirm this trend and might point to substantially lower prices in the near future. Stochastics (65) still has room to move higher so that perhaps opens the door to more upside. Generally, the technicals are still bullish and do not point to any exhaustion of this rally just yet. A failure to break above $113 this week would definitely give the bulls some pause, however.
This week may well begin bearishly as Mercury opposes Saturn. A significant decline is possible in the early week, perhaps below $110. But the midweek period looks bullish again as the Sun and Venus gather with Pluto. This could easily test previous highs at $113 and I would not be surprised if it broke above them. The end of the week could go either way, although it could well be higher. Next week looks more volatile, although it could feature prices moving sharply in both directions. I would therefore not rule out further gains although I do not necessarily expect them. Once Jupiter aspects Rahu on May 7, there is a greater likelihood for declines. There is a real chance for the declines to be large, although this is not certain. The second half of the month also looks bearish so it seems likely that crude will fall below support at $100 by this time at the latest. By early June, it is quite possible that crude will again be trading in its more familiar range between $80 and $92.
5-day outlook — neutral-bullish
30-day outlook — bearish
90-day outlook — bearish
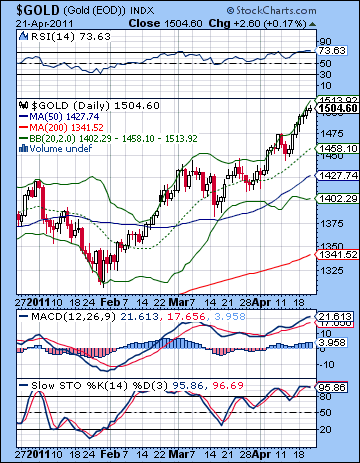 As the US Dollar tanked again on debt concerns, gold got an added shot of adrenaline as it finally crossed over the $1500 level closing at $1504 on the continuous contract. This bullish outcome was more or less in keeping with expectations, although gold did not experience any downside at all in the early week. Since I had been fairly ambivalent about the possibility of the pullback, this was not overly disappointing. And that quick run to $1500 finally happened as gold went over the top on Wednesday. As long as the US Dollar continues to be shunned, gold will benefit and move higher. RSI (73) is officially overbought on the weekly chart although it could continue to climb for another week or two before maxing out. Even if it reverses lower this week, the RSI chart will have produced a series of declining peaks. Not to make too much of it, but this pattern may eventually describe a significant pullback. The daily chart also features the RSI at 73 so it is similarly overbought. Not exactly an enticing place to go long, in other words. Stochastics (98) are about as high as they can go here, while MACD entered a bullish crossover. Interestingly, it is in a negative divergence with respect to the previous high. Resistance is around $1530-1550 now from the rising channel while support is $1380-1400.
This week looks more mixed as Monday could see a decline with gains into midweek on the Sun-Venus pattern. What is more perplexing is that there are mixed signals for the end of the week. While crude looks more positive, gold looks negative in some measurements. I would tend to think that gold will ease off its midweek highs by Friday although it is unclear if it will close lower on the week. Probably it will close somewhere between $1480 and $1520. Next week looks more negative, however, as Mars conjoins Jupiter. The early week could shake things up quite a bit so it is possible we could see a 2-3% decline at that time. Some rebound is likely at the end of that week. Then we could see the beginning of a more serious correction after that extends into late May and early June. I had expected that it would be large enough that we would break the rising trendline at $1380 but now I’m not so sure. It could be that we will only pullback to support and continue to bounce higher. I would not say that bullish scenario is exactly probable, however, but its likelihood is increasing. This is something to consider when the correction finally gets underway in May. Given the relentless climb of gold, I’m prepared to be underwhelmed by any correction. And yet for that very reason, the market is so overstretched that is could be ripe for a fall that is bigger than anyone might expect. Regardless of how low it goes, we should nonetheless see a significant rebound begin in June, probably sometime after the 7th.
5-day outlook — bearish-neutral
30-day outlook — bearish
90-day outlook — bearish