

- Stocks vulnerable to declines Monday but may rebound midweek
- Early Dollar strength likely unsustainable through the week
- Gold mostly bearish
- Crude trending lower
- Stocks vulnerable to declines Monday but may rebound midweek
- Early Dollar strength likely unsustainable through the week
- Gold mostly bearish
- Crude trending lower
With the Goldman Sachs’ sell-off offsetting some positive earnings results from Alcoa and Google, stocks were largely unchanged on the week. The S&P traded as high as 1213 before Friday’s decline sent the index lower closing at 1192 while the Dow finished at a still respectable 11,018. While I did expect some gains this week that would push the S&P closer to its upper resistance channel, I unfortunately did not foresee Friday’s pullback. Certainly, I had noted the fact that the ingress of the Sun into Aries and the completion of the Uranus-Neptune aspect increased the medium term bearish influence. And I also pointed out that the planets for this Monday, April 19 looked quite bearish indeed so that pattern may have manifested a little earlier than expected. The week started somewhat flat as the Moon-Saturn aspect on Monday went nowhere and Tuesday’s Venus-Rahu aspect similarly failed to produce much action. Wednesday’s significant gain of over 1% coincided with the Sun’s ingress into Aries and the New Moon. I thought the Moon’s position was bullish but was unsure if it had the ability to take prices higher. I should note here, however, that while the Sun’s entry into Aries corresponded with a nice gain, we should not extrapolate that the whole transit of Aries will be bullish for stocks. The initial ingress was likely positive in this case due to the support from the Moon, rather than any inherent attribute of Aries. Since it is a medium term influence that extends for the 30 days of the Sun’s transit through that sign, its full effects can only be evaluated over several weeks. And given the debilitated state of Mars, I am still expecting these Aries transits to take the market lower. Thursday saw a continued bullish bias as the Moon approached Mercury and Venus but Friday’s decline was unexpected as the proximity of the Venus-Jupiter aspect was not enough to support prices. One possible explanation for the failure of stocks to rally here was that the Moon had passed Venus and thus emptied the Venus-Jupiter aspect of much of its strength. Also, the market may have got a head start on Monday’s nasty looking aspect as the key planets moved into range of each other. In light of Friday’s decline, can we now suggest that the top is in? Well, the market came very close to that resistance line around 1220 last week and with further declines likely this week, there is a reasonable chance that the near term top is in. That said, we still can’t be certain that the market won’t rally all the way back in June or July from any correction we see here. But the price moves this week add evidence to the notion that the resistance line will hold in the short term.
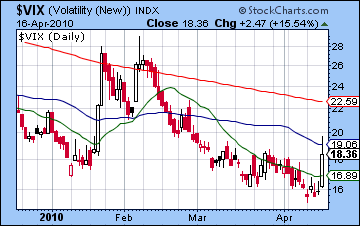
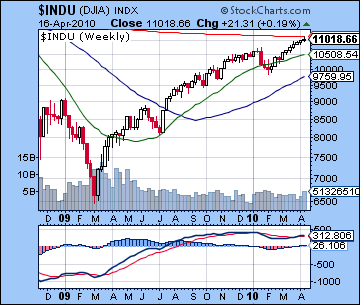 Friday’s sell-off came on very high volume as 7 billion shares were traded on the S&P and that makes it a clearly bearish signal. Although the gains of the preceding days occurred on rising volume, Friday’s sudden and sharp reversal undermined any possible bullish reading from midweek. MACD is still slightly positive, and the negative divergence is still evident even including Friday’s decline. CCI (80) has fallen below the 100 line, but its current levels match previous lows in the recent rally so we cannot consider this indicator as signaling a correction. RSI (60) is looking more vulnerable, however, after hitting a high of 80 last week. It is now matching the levels it reached back in March when it was rising. This is therefore perhaps a more bearish indicator. The $VIX climbed to 18 although it remains below its 50 DMA and thus may not yet be regarded as signaling a breakout that would accompany a correction. However, its MACD shows an increasingly positive divergence, and that should be seen as more persuasive evidence that a correction in stocks is at hand. Not surprisingly, the number of 52-week highs fell sharply at the end of last week. Perhaps more importantly, the number of highs made on Wednesday barely exceeded the peak made in mid-March. Given the higher prices over the past month, this is a bearish divergence that indicates a narrowing of the rally. The inability of the bulls to break above resistance at 1210-1220 should be seen as increasing the likelihood of a correction in the coming weeks. The market closed near immediate support levels provided by the bottom rising trendline from the February low. These two trend lines form another bearish wedge so that if resistance cannot be broken, prices will likely move lower. If support at 1080-1090 and the 20 DMA is broken this week as I expect, then the 50 DMA at 1140 would be the next level of support. It probably won’t dip this far right here but it is a possible near term target. We could see prices fall towards 1140 this week before rebounding next week perhaps towards the previous support line at 1190. That would set up a classic correction where the support from the wedge becomes resistance and the market probes lower towards the 200 DMA at 1060-1080.
 This week begins with that alignment of Sun, Saturn, Uranus and Neptune on Monday. Actually, the Sun will have moved past its exact aspect with Saturn by the open of trading, so it’s possible the market may be less bearish than overseas markets which will still be responding to the implications of the Goldman Sachs’ fraud charges. But the day still seems to have a cloud hanging over it since the Moon will be in Gemini and will receive the full aspect of Saturn. The midweek period offers some prospect for gains, however, as Venus enters Taurus on Tuesday. This will be a potentially important clue for the future direction of the market since a decline here would suggest that the bullishness of Venus is been overwhelmed by the imminent formation of the Saturn-Uranus aspect. I would expect one to possibly two days of gains between Tuesday and Thursday as the Moon transits its own sign of Cancer then. Wednesday is perhaps the most bearish of the three midweek days, so we can perhaps expect losses then, particularly if Monday or Tuesday has seen a rebound. Friday looks more negative again as Venus takes its turn to align with Saturn, Uranus and Neptune. Overall, the strength of the negative patterns at the beginning and end of the week suggest a negative outcome is most likely. At the same time, Monday could see down open only to have the market reverse midday. That is something to watch for. The downside amplitude of the Monday and Friday patterns would appear to be greater than any possible upside days we may see. So one possible scenario might be for a break in support Monday and Tuesday down to perhaps 1160-1170 and then a rally attempt back up to 1180-1190 by Thursday. This would then set up a possible close Friday somewhere around 1160-1180.
Next week (April 26-30) sees the Saturn-Uranus aspect exact on Tuesday. As I’ve already noted, this a potentially bearish planetary pairing that has the power to take prices down quite a bit either at the time of the exact aspect or perhaps in its aftermath. While it is difficult to pinpoint the time of its maximum fallout, I think the other aspects around this time also look bearish enough so the market will range from bearish to neutral. Monday begins on a Mercury-Mars aspect, albeit one that is separating and hence a little weaker than it otherwise would be. Some gains are likely Wednesday or Thursday on the Sun-Mercury conjunction with bears likely controlling the end of the week. The following week (May 3-7) seems mostly negative, especially on Monday, May 3rd and the Sun-Mars-Saturn-Rahu combination. This pattern also has the potential to drop prices quickly and without mercy. Stocks could well stay in a correction phase until Mercury’s direct station on Monday, May 12. After that, some kind of rally is likely into late May and early June. As Jupiter approaches Uranus we could see a violent snap back, especially if the preceding correction has been more than 10%. The market will likely get shaky in the last week of May and first week of June as Venus conjoins Ketu and Saturn once again turns direct on May 30. At this point, I expect prices to rise through most of June but it is unclear if we will see significant new highs. All things considered, the more likely scenario would be for lower highs, perhaps to 1150-1200 on the S&P and somewhere below 11,000 on the Dow. It is conceivable the market will hold up more or less intact into July but as before, the second half of July looks quite bearish so we may see another breakout on the downside at that time.
5-day outlook — bearish SPX 1170-1190
30-day outlook — bearish SPX 1080-1140
90-day outlook — bearish-neutral 1100-1200
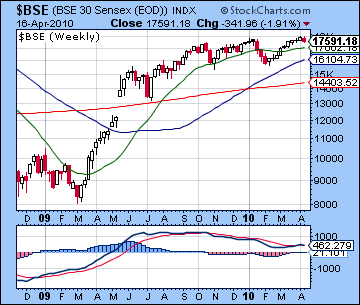
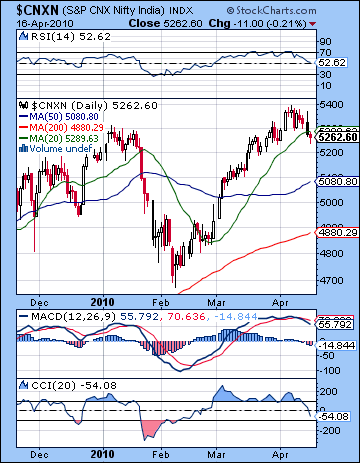 Stocks in Mumbai slumped last week as concerns over future rate hikes overshadowed continued foreign buying. The Nifty was off almost 2% closing at 5262 while the Sensex finished at 17,591. While I had expected a little more upside along the way here, this bearish outcome was not too surprising given the presence of some key negative influences. Monday turned out to be weaker than expected as the Pisces Moon conjunction with Uranus (4 Pisces) did not generate much enthusiasm, possibly due to the approaching opposition aspect from Saturn (5 Virgo). This was an important clue that previously bullish Uranus contacts are now rendered more negative because of the closeness of Saturn. Tuesday also had a negative bias, although that was perhaps more in keeping with the forecast given the Venus-Rahu-Ketu pattern in the NSE chart. After the holiday closing Wednesday and Aries New Moon, Thursday saw the market take a significant drop. I had thought the chances of a decline here was fairly good although I was not certain due to the generally favourable position of the Moon. Friday saw an improvement in sentiment on the approach of Venus to Jupiter but the bias will still negative as the market registered a very modest loss. This added greater evidence to the view that the medium term influences may be taking over here. Tuesday’s completion of the Uranus-Neptune aspect appears to have manifested more or less at the time of its exactitude and suggests that a negative bias may be establishing itself. Moreover, the entry of the Sun into Aries on Wednesday may create more problems for the market over the next 30 days due to the debilitated condition of its ruler, Mars. While Venus will leave Aries and enter Taurus this week, both the Sun and Mercury remain in Aries, and thus their ability to promote confidence and buying are significantly compromised. Overall, the planets are strongly indicating an imminent correction here, although we should note that the direction may not be straight down. After another rally attempt or two, this consolidation process may well extend into the second week of May.
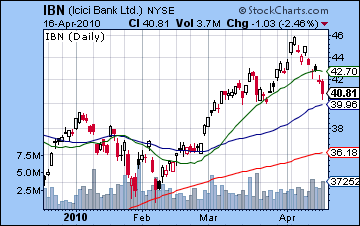
With the decline off the recent highs, the market shows significant deteriorating technical conditions. The Nifty shows a clear bearish crossover in the daily MACD chart. CCI (-54) is looking very bearish and appears to be heading towards the -100 line in short order. RSI (52) is looking slightly better but has eroded substantially from its recent highs. Since it still has a considerable distance to travel before it falls below the 30 line, we should see more declines here. Currently, the Nifty is sitting almost precisely on the rising channel support line from the February low around 5250. It is noteworthy perhaps that this also corresponds with the rising channel support line from the market lows dating back to last autumn. The intersection of these two critical support lines at this level at this time underlines the significance of the current market circumstance. Like most global markets, Indian indices have formed another bearish rising wedge and prices are in danger of breaking below the rising support line. If they do break this week, the next support level may be the 50 DMA around 5000-5100. I would not be surprised to see this tested in the coming days. Break downs in wedges are often followed by rally attempts that take prices back to the previous support level, so we may expect to see rally attempts late this week or next that could go as high as 5200-5300. Below that, the 200 DMA and previous February low around 4700-4800 could bring in new buyers in the event that the correction is protracted into May. I think this is the most likely scenario at this point, although we should first see a decisive break of the bearish wedge this week in order to that longer correction scenario to play out. For its part, the weekly MACD chart on the BSE still shows a bullish crossover, but it is very small and part of a larger bearish divergence. For that reason, it is not an especially persuasive indicator of higher prices in the near future. As a reflection of the troubles of the financial sector this week, the chart for ICICI Bank (IBN) shows it has fallen to the 50 DMA on fairly high volume. It is often a bearish indicator when down day volume is greater than up day volume.
 After Mercury turned retrograde on Saturday, this week looks generally bearish although there is a good chance for two up days. Monday features a very strong alignment of the Sun, Moon, Saturn, Uranus and Neptune. This looks quite negative given the Moon’s position in Gemini will be afflicted by Saturn’s aspect. I should note that the Sun-Saturn aspect will be a bit past exact during the trading day so that may indicate that the open could be worse than the close. Given the large number of planets involved, it is possible we could see a sizable move here. Venus enters Taurus on Tuesday and this may be seen as a background bullish influence. We should expect some kind of gains midweek, with perhaps Tuesday and Wednesday as the most likely candidates. This is not to say that both days will be higher, but the two days could well be net positive, especially if Monday is lower. The end of the week looks more problematic for stocks with Thursday perhaps standing out more in that regard. The Moon conjoins Mars while Mercury approaches its aspect with Mars. Friday sees Venus approach its alignment with the trinity of Saturn, Uranus and Neptune and that, too, could be difficult for stocks. But the Venus aspect is still over a degree away, so it is harder to call for sure. Probably Thursday and Friday will split one day up and one day down, although I think the two days will be net negative. So there is reasonable evidence for lower prices this week. I still believe the deeper declines could occur in early May, so in case the declines are more modest than expected here, I would expect more weakness over the next two to three weeks.
 Next week (Apr 26-30) features the exact Saturn-Uranus opposition on Tuesday, the 27th. I don’t expect anything sudden or earth-shaking to occur on that day, but it is nonetheless an important factor in the overall picture. It is quite possible that the market could be mixed here, as a rally attempt is likely after any breaches in the rising wedge. Monday could begin the week bearishly but watch for a recovery going into the Sun-Mercury conjunction on Wednesday and perhaps even Thursday. Friday looks weak again. The following week (May 3-7) begins with a very negative pattern involving the Sun, Mars, Rahu and Saturn so I am expecting sellers to predominate then. This appears to be the most likely time when the Nifty could fall below 5000 and test the 200 DMA. As Jupiter enters Pisces and begins its approach to Uranus we should see a significant rally take place for the bulk of the month of May. In the most bearish scenario, the Nifty may correct down to 4500-4700 or so in early May with a rally into mid-June back to 5000-5200. This would then be followed by further erosion in July ahead of the steeper declines I am expecting for late July and August. The most bullish scenario would see a milder pullback to 5000 on the Nifty followed by new highs of perhaps 5500-5700 into mid-July. The larger down leg would then take place in accordance with the Mars-Saturn conjunction in late July. No doubt we will end up somewhere between those two possibilities, although I would lean more towards the bearish scenario here.
5-day outlook — bearish NIFTY 5050-5150
30-day outlook — bearish NIFTY 4800-5000
90-day outlook — bearish-neutral NIFTY 5100-5400
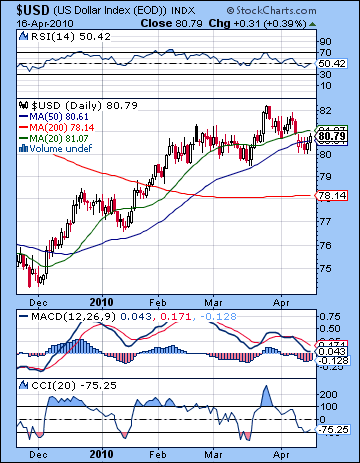 After gaining ground on Friday’s Goldman Sachs scare, the Dollar ended the week largely unchanged below 81. This is in keeping with my expectations for a neutral and choppy week as the planets generated mostly offsetting indications. Monday’s sell-off occurred in close proximity to the Venus-Rahu aspect and while I had expressed reservations about its effects, I was still inclined to think some gains were possible. The bearishness continued into Wednesday as the absence of any close aspects saw the dollar drift lower. I had expected weakness later in the week but the approach of the Venus-Jupiter aspect actually generated gains on Thursday and Friday. This was perhaps a reflection of Mercury’s minor but close aspecting of Jupiter and the Moon in the natal chart. Monday’s loss took the dollar below the rising trend line dating back to the December low. The rising trend line now stands at 81 so we will have to watch carefully to see to what extent this will become resistance in the coming days. Certainly, it increases the likelihood of further declines somewhat. Daily MACD is looking pretty bad here as it is in a bearish crossover and a negative divergence. CCI (-75) is also weakening here although it has yet to hit the bearish territory below -100. Interestingly, previous excursions below this line coincided with minor pullbacks so it would not be surprising to see another dip here. Of course, further losses would push prices that much further away from the rising support line. RSI (50) is also looking quite sickly after a brief foray below 50 earlier in the week. This is the lowest level for some time and shows the maturation and leveling off of the rally. Current prices sit close to the 20 and 50 DMA so that may act as further support here. Below that the previous low of 79.5 could bring in more buyers in the event of a correction. As before, resistance could be fairly strong around 82 so any gains above that level would be highly significant and suggest further gains down the road.
This week is hard to call. It may begin with some downside on the Sun-Saturn aspect on Monday since this will influence the natal Sun in the USDX chart. At the same time, retrograde Mercury will remain in an otherwise bullish pattern with the natal Moon and Jupiter. Since equities seem poised to go lower initially, I would think the dollar bulls will carry the day here. Tuesday to Thursday looks more solidly bearish, however, as transiting Mars will aspect the natal Ketu. I doubt all three days will be negative, as the end of the week looks more positive on the Venus aspect to the natal Sun. Friday is perhaps also a good candidate for a gain. So if Monday is higher, then the week overall has a good chance for a gain perhaps towards 82. But if that alignment turns sour, then I would not be surprised to see prices fall below 80 at some point in the week. Next week looks mixed at best with significant losses indicated on the Sun-Mercury conjunction on the 28th. The best time of the Dollar would therefore appear to be the first weeks of May. So we may see a larger pullback for the rest of April as prices move between 79 and 80 before recovering in May. There is a good chance that the resistance level above 81 will be tested at that time. The second half of May looks like more consolidation, perhaps between 80 and 82, and then another move higher is quite likely in June. This appears to peak somewhere between the 16th and the 25th.
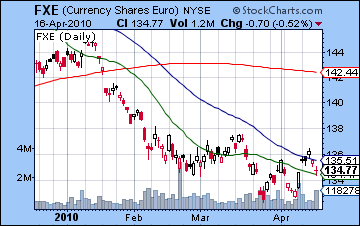 The Euro mostly treaded water last week closing just under 1.35. I thought it would be a bit more bearish but the early week saw gains on the Sun aspect to natal Rahu. I had also expected more late week gains on the Venus-Jupiter aspect but in the end, it was the Sun’s aspect to the natal Saturn that carried the Euro lower. The Euro appears to be in a holding pattern here around its 20 and 50 DMA between 1.34 and 1.36. And while prices have moved above the falling resistance line suggesting more strength, the weekly MACD chart is still in a bearish crossover. This seems like the a more reliable indicator at this point, particularly given the difficult planets coming up. And with air travel interrupted from the ash cloud coming from the Icelandic volcano, it seems as if the Euro is truly cursed this year. This is perhaps all in keeping with Saturn crossing its ascendant which points to an extended period of bad luck and failed efforts. A big move is possible Monday, most likely down given the travel chaos. The Sun is transiting the 8th house cusp in the Euro chart so that is broadly in keeping with the negative symbolism. Some gains are likely midweek, however, although they may yield to more selling by Friday. Next week looks more bullish on the Sun-Mercury conjunction but the bears will move in again in early May. We could see 1.30 by that time. The Rupee lost ground last week as it rose to 44.5 I am expecting it to eventually move towards 45-46 by early to mid-May, although any declines we see this week will likely be quite modest.
Dollar
5-day outlook — neutral-bullish
30-day outlook — bullish
90-day outlook — neutral-bullish
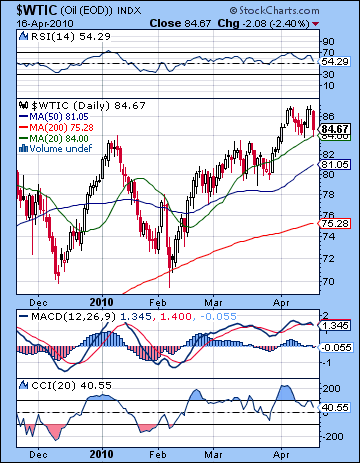 Crude pulled back last week as growing signs of credit tightening in Asia made investors skittish about long term prospects. After trading as high as $87 midweek, crude settled back under $83 on Friday’s close. I had expected some more upside here and in fact we got it although not exactly with the timing I had anticipated. Monday was lower as expected although Tuesday’s predicted gains on the Venus-Rahu aspect were disappointingly tiny. Wednesday’s gain arrived with the Aries New Moon while Thursday was mostly flat. I had expected more midweek downside from the transiting Sun to Mars aspect but that only showed up on Friday’s big sell-off. After this second failed attempt to reach $90, crude is looking more technically vulnerable here. Daily MACD has started a bearish crossover and now shows a clearly negative divergence. CCI (40) looks pretty limp as it kissed the 100 line good-bye and drifted out of the bullish zone. RSI (54) is falling and if it should break below 50 that would eclipse the previous low and indicate a larger correction. On the positive side, prices are close to the 20 DMA at $84 so that could bring in buyers. This level coincides with the support line from the February low so that a break below $84 would likely spark more selling. The 50 DMA around $81 may be tested next in the event of a more extensive sell-off. I would not rule out a test of this level this week, although it likely won’t last long since a rebound rally is quite likely in the middle of the week.
This week looks volatile as Monday’s Sun-Saturn-Uranus-Neptune alignment looks like it may produce a large move. The most likely direction is down, although these multi-planet alignments have a certain amount of unpredictability. The chances of a decline are somewhat increased, however, given the fact that the transiting Sun is close aspect to the natal Ketu in the Futures chart. Some rebound is likely through the midweek period but weakness will likely return near Friday as the Sun sets up in opposition to the natal Moon-Saturn conjunction. Next week looks quite mixed with large swings possible. The Sun-Mercury conjunction on Wednesday is likely to lift sentiment to a considerable extent. And with Jupiter (29 Aquarius) forming an exact square aspect to the natal ascendant (29 Taurus), there is good reason to expect gains to offset declines. So we could see prices move between $80 and $85 over the next two weeks and then break below $80 in May. Given that it marks the last two significant lows, $70 could be a possible target then. Crude should then move higher into early to mid-June, possibly reaching its previous highs around $85-87.
5-day outlook — bearish-neutral
30-day outlook — bearish
90-day outlook — bearish-neutral
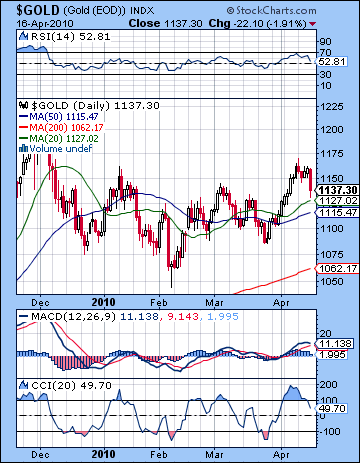 After briefly trading at $1170 on Monday, gold fell back down to earth last week closing at $1137 on the futures contract. I had been more bullish in the short term here, and while gold did manage to run-up a bit higher Monday, the week was mostly bearish. As expected, however, we did see weakness on Monday and Tuesday ahead of the Sun’s ingress into Aries. Wednesday and Thursday saw very modest gains as the Sun was boosted by the co-transit of the Moon into Aries on the New Moon. I missed Friday’s sell-off, however, as I expected more staying power from the Venus-Jupiter aspect. As it happened, gold appears to have been more directly affected by the transiting Sun (3 Aries) coming under the aspect of natal Saturn (3 Cancer). The technical situation of gold is still fragile. On the bullish side, it remains in a bullish crossover in the daily MACD chart. CCI (49) is weakening and may well be headed for bearish territory in the near term. RSI (52) also may be headed lower as previous down moves have tended to reverse around the 40 level. The inability of gold to break above $1160 last week means that is an increasingly important resistance level going forward. Support could come from the 20 and 50 DMA now clustering around $1115-1130. While the moving averages have not acted as strong support in the recent past, prices have not strayed too far from these lines. Below that, the 200 DMA of $1060 could be medium term support in the event the correction is extended into May. This coincides with the February low.
This week will begin with an interesting alignment of Sun, Saturn, Uranus and Neptune that activates the ascendant (5 Sagittarius) of the GLD chart. If the Sun had activated this point by itself, it likely would be corresponded with gains. However, in this case, Saturn is likely to change the outcome as the week looks generally bearish. We should see some kind of gain midweek as transiting Venus aspects the natal Sun. This is most likely to occur Wednesday, although Tuesday may also be positive. Negativity is likely to rule as we move closer to the end of the week as the transiting Sun conjoins the natal Rahu. Friday may be somewhat more bearish than Thursday. Overall, it looks like a down week here, perhaps breaking below the 50 DMA at $1115. We can expect gold to stay mostly bearish until about May 10 and then reverse higher for much of May. At this point, there is a reasonable chance of testing the 200 DMA at $1060 in early May. The rebound rally is likely to be fairly modest and will likely not break $1160. The end of May and early June looks very bearish. While gold is likely to stay weak through the summer, it will likely begin to rise in earnest in October and November.
5-day outlook — bearish
30-day outlook — bearish
90-day outlook — bearish-neutral