

 (8 June 2025) Stocks pushed higher again last week on the prospect of direct Trump-Xi talks and the possibility of a trade deal with China. Friday’s strong jobs report also didn’t hurt as the US economy continued to show resilience in the face of growing signs of recession. With the S&P 500 hitting the 6000 mark, the major US indexes are now just 2% from making new all-time highs.
So how much longer will this rally last? Evidence suggests the current planetary influences could keep bulls in control for a bit longer. My previous statistical analyses suggest the upcoming double square of Jupiter-Saturn and Jupiter-Neptune on June 15 and June 18, respectively, could be potential turning points. Data from the past 120 years shows that similar alignments tend to be somewhat bullish in the days leading up to the exact aspect and then become more bearish in the days following. While neither alignment was strongly bullish by itself, the combined effect may be moderately positive for stocks until mid-June. This celestial seasonality therefore favors bulls until June 18.
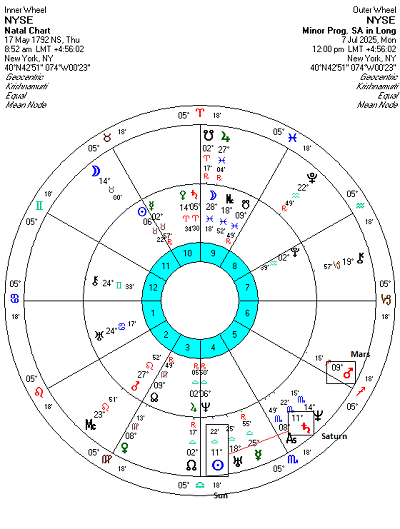
This raises the possibility of some kind of pullback after June 18. This is not only because of the diminishing bullish influence of double square but also because of other more bearish influences that are likely to manifest at that time. One such influence is minor progressed alignment between the Sun and Saturn in the NYSE horoscope (dated May 17, 1792). I am big fan of progressions as they provide useful information that can confirm trends and reversals that mare suggested in conventional transit analysis.
Minor Progressions
Briefly stated, progressed charts are derived from the natal chart based on a system of symbolic equivalences. For example, a secondary progression equates one day of clock time to a year and yields a time ratio of 1:365. A tertiary progression equates one day of clock time to one lunar month (a time ratio of 1:27) and a minor progression equates one lunar month of clock time to represent a year (a time ratio of 1:13). Alignments within these various progressed charts can be very important and provide additional sources of information about collective market sentiment. For example, I noted on April 5 that the approaching Sun-Jupiter alignment in the tertiary progressed NYSE chart strongly suggested a major rebound was likely in the month of April. That rebound happened in spades as stocks rallied strongly off its oversold levels on April 7.
Hypothesis and Method
The minor progressed Sun will form a 30-degree alignment with minor progressed Saturn on July 7, 2025. Progressed Mars is fairly close to joining this alignment although it is far enough away to omit it from consideration for now. In keeping with standard Western astrological assumptions, I take all alignments that are multiples of 30 degrees to be potentially significant. While the various aspects are unlikely to be equally powerful, the blending of the energy of two planets is still more likely to occur when these 30-degree alignments are at their closest. And since Saturn is a malefic planet, my hypothesis here is that all Sun-Saturn aspects are likely to be bearish in some way. I would also guess that the effects of this alignment are more likely to be felt in the time near the exact alignment, and especially in the days leading up to the alignment since the applying aspect is said to be more effective than when the aspect is separating.
Due to time constraints, I was limited to creating a relatively small study of just 22 cases dating back to 2000. Obviously, this isn’t large enough to arrive at any definitive conclusions about the effect of this aspect. Nonetheless, it may be large enough to shape our bias one way or the other depending on the evidence. In the minor progressed chart, the Sun forms a significant alignment with Saturn about every 13-14 months. The selection of time intervals was determined by the speed of the minor progressed Sun which travels about one degree every 13 days. Thus, the longest 30 day interval represented about a 2 degree applying aspect orb, the 10 day interval represented a slightly less than 1 degree orb and so on. While Sun-Saturn aspects may exert influence beyond this 60-day window, especially if the Moon acts a sort of bridging influence, I wanted to keep things simple by focusing on the narrowest orb to see if any patterns emerged.
Results
Overall, the effects of this aspect seem bullish. The percentage change in the longest 60-day window (first column;”-30d 30d”) was positive with an average gain of 2.60%. This was substantially greater than the expected value of 0.90% based on an average annual gain of 5.4% for the period of 2000-2024. A couple of very large gains in 2004 and 2009 no doubt skewed the results somewhat, although the fact that the median gain was 2.91% suggests that this is still a fairly bullish influence throughout that long interval of 60 days.
However, if we focus on shorter intervals, a different picture emerges. The 30-day interval (second column; “-30d 0d”) leading up to the date of the exact alignment was still positive (0.71%) and exceeded the expect value, although less so. The 20-day interval (third column; “-20d 0”) leading up to the exact aspect was bearish, however, with an average change of -0.47%. The median was also negative (-0.22%) and a slight majority of cases were also negative. This was the most bearish interval in the study. Narrowing the window further to just 10 days (fourth column; “-10d 0d”) also produced a negative result (-0.51%) although the median was positive (0.56%). The smallest 5-day window (fifth column; “-5d 0d”) was slightly negative (-0.02%) although here again the median was positive. All other intervals were positive.
Conclusions
The evidence presented here suggests minor progressed Sun-Saturn aspects are generally bullish. This was somewhat unexpected given the traditionally negative understanding of Saturn aspects. That said, the absence of a robustly negative result isn’t entirely surprising since minor progressions are only one layer out of several, and the Sun-Saturn aspect is only one alignment out of dozens of possible two-planet alignments. Nonetheless, I was curious to see how this apparently bearish pairing would manifest across many cases.
However, our bearish hypothesis was at least partially salvaged since some negative influence was seen in the shorter intervals leading up to the date of the exact alignment. The 20-day window before the exact alignment was the most bearish as evidenced by all three of the average, the median and % of positive cases yielding below the expected values. Nonetheless, the very modest magnitude of the decline more or less precludes its use in a trading strategy by itself. But when combined with other factors we could make an argument for being more cautious in the preceding 20 days before July 7.
Implications for upcoming Sun-30-Saturn alignment on July 7, 2025
If there is some modest bearish influence in this aspect, it is more likely to manifest in the 20 days before the Sun-Saturn alignment. This equates to June 17-July 7. Interestingly, June 17 is very close to the time of the Jupiter-Saturn and Jupiter-Neptune squares. Since the evidence suggested these Jupiter aspects could serve of turning points for the rally, the coincidence of the bearish time window for the minor progressed Sun-Saturn aspect becomes confirming evidence for a bearish phase in late June and early July.
Even more interesting is the fact that the Fed will deliver its latest policy statement on June 18 at the FOMC meeting. The tight clustering of dates of these various influences shine a light on the Fed meeting as a time when a trend reversal is more likely. But whether any mid-June trend reversal is short term or long term remains to be seen. It is still very possible stocks will rebound after any pullback on this Sun-Saturn alignment. Thus, the period after July 7 may become more bullish on the positive impact of the long 60-day time window from this Sun-Saturn pairing.
