

- Possible weakness in stocks early that could test 200 DMA; gains by later in the week
- Early strength but Dollar to weaken by Friday
- Gold possibly pushing to new highs by midweek but declines loom in late May
- Crude oil stabilizing after early week downside
- Possible weakness in stocks early that could test 200 DMA; gains by later in the week
- Early strength but Dollar to weaken by Friday
- Gold possibly pushing to new highs by midweek but declines loom in late May
- Crude oil stabilizing after early week downside
Europe’s debt problems continued to dominate financial markets last week as stocks ended 2% higher. The initial euphoria over the $1 Trillion aid package pushed prices significantly higher into Wednesday but skeptics ruled the roost after that as the Dow closed at 10,620 and the S&P finished at 1135. While I had expected some kind of bounce overall, I did not foresee the gains occurring early in the week ahead of the Mercury direct station. Monday’s stunning relief rally came about with only fragmentary astrological evidence as the Moon-Uranus conjunction in Pisces reflected only a modicum of optimism. The event was a reminder of the importance of a margin of error, especially around volatile Mercury stations. I had noted the supportive influence of the Sun-Venus aspect last week and certainly it was quite close to exact throughout the week. What I did not expect was that it could manifest so early while leaving the end of the week vulnerable to the underlying negative energy of the Saturn-Uranus-Neptune alignment. Certainly, this rare three-planet aspect has halted the 13-month recovery rally in its tracks for the moment. The exact Saturn-Uranus opposition on April 27 closely coincided with the high of SPX 1219 and the market has been falling ever since. This is an exceptionally powerful influence that is made more potent by virtue of the slow speeds of Saturn and Neptune, both of which will station and reverse their direction on May 30-31. This is likely to act as a drag on markets for the next few weeks when Saturn once again moves forward. While Saturn will leave Neptune behind in June, it will once again encounter Uranus in late July. This will likely generate renewed worries around the issues of risk and regulation and the viability of high levels of sovereign debt. This is also one reason why the second half of the year may also see broad-based declines. Not only will Saturn oppose Uranus in July for the final time in this aspect series, but it will be joined by Pluto in August. The grouping of these three slow moving planets into a tense t-square arrangement is very unlikely to coincide with rallies. Indeed, it seems all the more likely to take prices down substantially. The presence of Jupiter is in these patterns is something of an unknown factor since it is considered a bullish influence. In fact, we will soon get a first glimpse of Jupiter’s influence in late May when it forms a conjunction with Uranus at 6 Pisces. At the moment, it has only served perhaps to magnify the moves in both directions as the bearishness of the other three key planets have taken precedence. Jupiter (3 Pisces) will oppose Saturn (3 Virgo) next Sunday May 23 so that will warrant close watching. My sense is that it will act as a support on prices around that time but we will likely see another fall shortly after. Jupiter will also enter the mix in July as it again opposes Saturn and conjoins Uranus after it turns retrograde. This is once reason why I think we have to allow for some kind of summer rally ahead of another leg down in the second half of 2010.
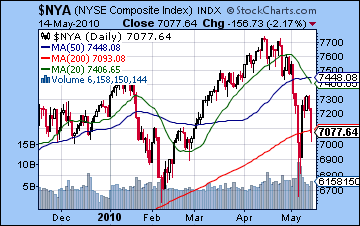
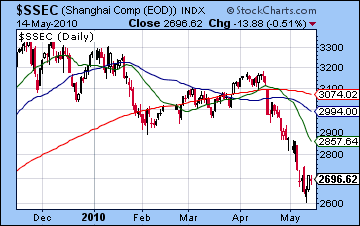
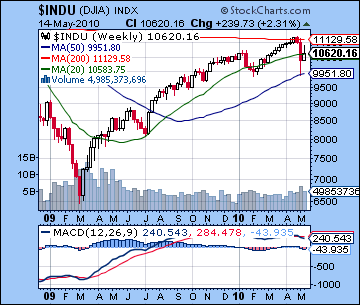 With the late week sell-off, the market seems intent on retesting the lows of May 6-7 at SPX 1065. The EU bailout rally went as high as SPX 1174 which matched the 50 DMA. The market tried several times but could not climb above this level. This should therefore be a significant resistance level going forward. We are still a fair distance from that level now, as the market will first have to deal with 1150 before taking on 1174. This acted as fairly reliable support throughout the week but collapsed on Friday as more investors threw in the towel. Given the fear in the market, support levels are perhaps of more immediate interest. While Friday was bad with 90% down volume, it is noteworthy that prices stayed above the close of Thursday’s "flash crash". This may mean that the retesting of lows may not go all the way down to 1065 in the immediate future, but perhaps only the higher closing low of 1110. Nonetheless, the technical indicators look weak. Volume was not overly impressive on the up days early last week and Friday’s decline accompanied an increase in volume. Daily MACD is still in a deep negative crossover and below the zero line. CCI (-102) climbed out of bearish territory only to fall back in the muck on Friday. RSI (41) is again falling after bouncing off 30. It displays a very bearish looking series of declining peaks that may point to still lower prices. And despite the overall gain last week, MACD on the weekly Dow chart is still in a bearish crossover and negative divergence Perhaps more troubling is the fact that the NYSE Composite ($NYA) closed Friday on its 200 DMA, the worst performing of any major index. Once these indexes begin to test and then fall below their 200 DMA, they can precipitate a larger decline. This is what happened to the Shanghai market in April and it has been falling ever since. This failure of the 200 DMA to provide support was one of the features of the US market in 2008. Usually, it happens in two stages. First, there is a clustering of the 20, 50 and 200 DMA to reflect recent declines undercutting a long rally. Then prices slowly slip below the 200 DMA and what was once support then becomes resistance. I don’t quite see this clustering of averages just yet, but we will have to wait for the kind of damage we see in the early June period. At this point, I think it is more likely we will see the first clustering phase take place in July or August.
 This week looks like more volatility especially early in the week. Like two weeks ago, there is a high number of aspects occurring in a short time span so calling individual days is tricky. On Monday and Tuesday, the Sun and Venus will activate the larger alignment involving Jupiter, Saturn, Uranus and Neptune. Since the aspect occurs with Jupiter first we should be open to the possibility of another relief rally on Monday. Perhaps there will be another encouraging government announcement over the weekend that prompts a rally. The difficulty here is that the aspects are so close together in terms of degrees and time, their effects may be blurred. I do think we are very likely to see at least one more major down day on either Monday or Tuesday. While both days are potentially negative, I would lean towards Tuesday as the a better candidate for a down day. In the event that Monday is the down day, we may well see 1110 or lower on the S&P at the close. If on the other hand, we see an up day Monday, then the Tuesday’s lows could be test current levels around 1130. Even with the potential saw-off here, we could well be net negative for the two days. Gains are more likely to stick as the week progresses as Venus makes an aspect with Uranus and Neptune on Wednesday and the Sun repeating that pattern on Thursday. The rebound rally may well last into Friday as Jupiter is just two days from its exact aspect with Saturn. Generally speaking, I would expect some further downside probing on either Monday or Tuesday, with a chance we will see a blowout sort of day (>3% decline) that takes the market on an immediate retest of the 200 DMA at 1100 or lower. However, I do not think this is the most likely scenario. If Monday is higher then the low for the week might be 1120-1130 on Tuesday or Wednesday morning. Assuming we don’t retest the 200 DMA on Monday then, the market could finish near 1150.
 Next week (May 24-28) may reflect the growing influence of Jupiter ahead of its conjunction with Uranus. For this reason, a stable to rising market seems like the most likely outcome. Weakness is more likely towards the end of the week as Venus approaches Ketu. It is possible that we could see an interim high formed during this week, perhaps near the 50 DMA at SPX 1170. The following week (May 31-June 4) looks more bearish as Mars will activate the alignment of slow moving outer planets. With Saturn at a dead stop on May 30, this Mars influence could be very damaging indeed and begin another move down. Since I am expecting more bearishness the following week (Jun 7-11), it is possible that this will be part of a longer two week retest of the May lows, wherever they end up being. If there is going to be a retest of Dow 10,000 and SPX 1065, we could well see it around June 8 as Mercury aspects Saturn and Mars aspects Jupiter. After that, gains are more likely to accumulate through July. As I noted last week, we could see the formation of a head and shoulders pattern with SPX 1150 reached sometime in July ahead of another major leg down. But given the strength of Monday’s rally, we should not completely rule out another run to 1200 or higher in the summer. Whether or not the market can rebound that far will depend on how low we go in this current correction. If we go all the way down to 1065, then the chances of seeing 1200 again are reduced. If we only end up retesting 1100, then 1200 becomes more doable. Again, I think the market is heading lower in the second half of the year with August and September looking the most bearish.
5-day outlook — neutral-bullish SPX 1130-1150
30-day outlook — bearish-neutral SPX 1100-1130
90-day outlook — bearish-neutral SPX 1100-1150
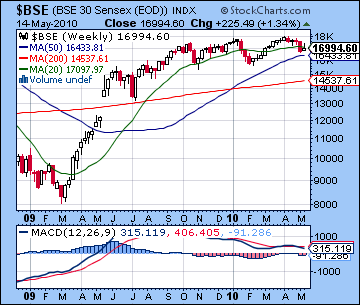 Buoyed initially by the mollifying effects of last weekend’s huge European aid package, stocks managed a gain of less than 2% last week. After trading as high as 17,300 midweek, sentiment turned negative on Friday as the Sensex closed at 16,994 and the Nifty finished at 5093. While I had allowed for some gains here, I did not expect to see the week play out with gains preceding declines. Monday’s surge on the bailout package was certainly unexpected coming as it did ahead of Mercury direct station. If nothing else, Mercury is unpredictable and the times around the beginning and end of its retrograde cycle are often hard to nail down. Nonetheless, I did suggest that Monday would be more bullish than Tuesday. We did see modest gains on both Wednesday and Thursday as expected as Mercury reversed direction and the Sun-Venus aspect tightened. Friday’s decline was somewhat unexpected since it anticipated some of the bearishness to come from the massive alignment this week. Amidst the Eurozone turmoil, it seems the market has fallen prey the negative effects of the Saturn-Uranus-Neptune alignment that has come into focus over the past few weeks. While Indian markets have fared better than some, it seems unlikely that it can escape the immediate effects of the vice-like grip of these malefic planets. Just as the speculative bubble popped in 2008, we appear to be witnessing the bursting of another bubble, namely that which has been fueled by excessive sovereign debt. The past two years have seen bad assets shift from private banks and corporations onto governments around the world in an attempt to stimulate their way out of recession. The most recent Saturn-Uranus opposition has coincided with investors waking up to the reality that the debt may not not sustainable in the long term and that losses will have to be incurred by someone. While the situation looks fairly bleak, it is unlikely to find resolution in the near term. There will be another Saturn-Uranus aspect in late July so that may bring out some of these latent energies once again and force the market to again weigh the relative risk of speculative assets like stocks. As I have noted before, I am generally bearish for 2010 as I believe this bad debt must work its way through the system. This is only starting to happen now as equities are undergoing a revaluing of their intrinsic worth.
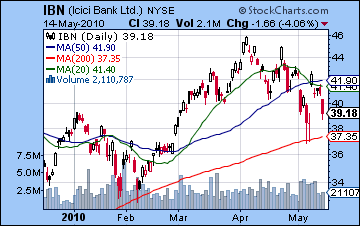
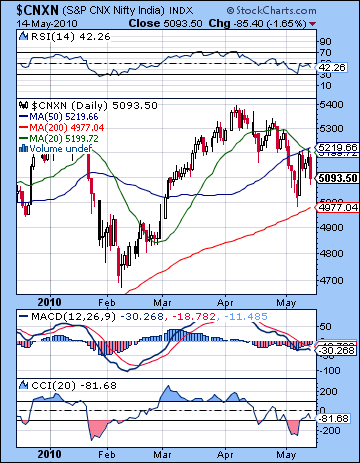 Monday’s gain prevented the Nifty from falling below its 200 DMA at 4977 as the retest from the 7th was confirmed. This will become an important level over the next few weeks as it will likely be retested at least one more time. The rising wedge has now become resistance at 5250 as Thursday’s high did not match that level. It also bounced off the 50 DMA at 5219 before closing lower and then falling through Friday’s session. So the indexes are in that fairly narrow moderately bearish zone between 50 and 200 DMA, just as they were in the previous correction in January and early February. For all the sound and fury over Europe, perhaps this correction might be of equal magnitude to that one. Certainly, one can make a case for that view. Both moving averages are still rising suggesting momentum has not completely dissolved. And both corrections have lasted about a month — so far. Daily MACD is still in a bearish crossover and is falling below zero now. CCI (-81) has climbed out of the bearish zone but has not made it above the zero line in a while. And after bouncing off the 30 line, RSI (42) is falling again and shows a disturbing series of declining peaks over the past month. It may be more likely to test the 30 line again before it turns higher. In spite of last week’s gains, weekly MACD on the Sensex is still in a bearish crossover and in a negative divergence. Financials have been slammed in this correction as ICICI (IBN) has moved lower on the NYSE. Like the major indices, it is trading between its 50 and 200 DMA. One small positive point was that Friday’s volume was significantly less than the down days from the preceding week. This may be an indication that selling is abating. Thus far, this correction has only been 8% from peak to trough, which is actually less than the January correction. While immediately lower prices are likely this week, we may only end up testing the 200 DMA again at 4977. It is important that prices do not fall substantially below this level since it means the longer term rally is still intact. As noted above in the US stocks section, Shanghai recently fell below all three of its main moving averages in April and has been falling ever since. The narrowing of the gap between averages may be seen as the first stage in the next leg down. Once the clustering of averages occur, then prices will begin to trade near that level. The market then becomes more vulnerable to shocks since declines will break below all support levels. I don’t expect that to happen in the short term here, but we may well see that situation occur later in the summer. In the meantime, the rising wedge at 5200-5250 will be resistance in the event of any rebound rallies. I think there is a good chance it will get there sometime over the next two weeks.
 This week looks volatile to start as the Sun and Venus will move into close alignment with Jupiter, Saturn, Uranus and Neptune. These aspects are bunched together so forecasting their individual effects may be harder to do than usual. Given Friday’s difficult close in the US, one might expect a bearish open on Monday in Mumbai. And yet the Sun and Venus will aspect Jupiter first ahead of Saturn, so it is conceivable that we could see another Monday rally day as we did last week on the bailout announcement. I’m not at all certain of this outcome, however, since there are a lot of difficult planets here. The Sun-Venus influence may only release more negative energy in the short term. I do think that we will see another major down day on either Monday or Tuesday, and that period will likely be net negative. If Monday is not down, then Tuesday has a much better likelihood of ending deeply in the red. As we progress through the week, sentiment is likely to improve once the faster moving planets move past Saturn and Uranus. Risk appetite is likely to increase Wednesday and Thursday as the Sun and Venus aspect Uranus. The gains could even extend into Friday as the Moon enters Leo. Overall, I think the number of up days are likely to outnumber the down days, although I can’t be sure if the market will finish positive. The early week sentiment could be very negative and any rebound rally might have a difficult time offsetting those losses. It is possible we could see probing below 5000 early in the week but there is a good chance we will close above 5000, with perhaps a 50-50 chance of closing above 5100.
Next week (May 24-28) will likely see more stable markets as Jupiter forms a close aspect with Saturn on the 23rd. This bullish influence may last through much of the week, but declines are more likely as we approach Friday and Venus approaches Ketu and Mars enters fiery Leo. We may see an interim high made at some point in this week since prices are likely to fall again from here. I think it will be important not to be lulled into a false sense of security by any rebound rally here since it is unlikely to continue uninterrupted. The following week (May 31-June 4) looks more bearish as malefic Mars joins that alignment of slower moving planets with its opposition to Neptune. This is potentially critical since Neptune turns retrograde just a few days prior on 31 May. Saturn is also reversing its direction on 30 May, so there the chances of changes in price direction are that much higher. Prices are likely to climb higher after that with the rally continuing perhaps into July. Last week, I noted the possibility of a bearish head and shoulders pattern over the next two months. While this is still possible, we would need a more severe testing of the 200 DMA in the near term, preferably with a few closes below 4900. This is possible if the early June period is bearish, although much will depend on the kind of rebound rally we see over the next two weeks. Of course, if we do roughly match the February lows, many investors will spot the emerging H & S pattern and this will make the subsequent rally more weak and fragile than it otherwise would be. Highs for the right shoulder could be around 5300 for the pattern and a deeper sell-off would then ensue. This is still hypothetical at this point but it nonetheless something to watch out for. I have still not completely ruled out higher highs in the summer, although I do not consider that a probable outcome.
5-day outlook — neutral-bullish NIFTY 5000-5200
30-day outlook — bearish-neutral NIFTY 4900-5100
90-day outlook — bearish-neutral NIFTY 4800-5200
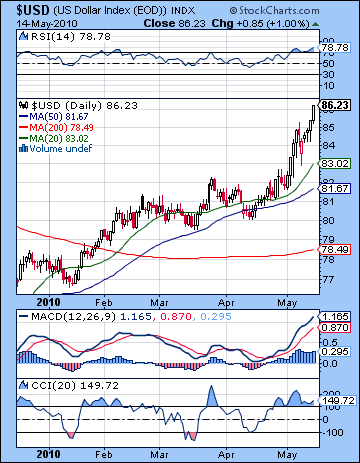 With all eyes on the drowning Euro last week, the US Dollar cashed in big time on its safe haven status. The US Dollar Index extended its recent rally to close above 86 for the first time since bad old days of March 2009. Now we are living through the "bad old days" of May 2010. I had thought the bulk of this phase of the Dollar rally was done for now, but I was wrong. The approach of Jupiter (2 Pisces) to the natal Sun (4 Scorpio) may be acting as a positive influence here and overriding the otherwise bearish Saturn aspect (4 Virgo) which also influences the Sun. This already exceeds our May target of 85 with more upside possible in the weeks ahead. Much of the appreciation has come at the expense of the Euro with many other currencies have only modest losses against the Dollar. Nonetheless, if the contagion becomes more thoroughgoing, more stable commodity based currencies such as the Canadian and Australian dollar are likely to fall by the wayside also. I had wondered if the Dollar could push above its resistance channel around 85 and it did, suggesting a parabolic run was not out of the question. The technicals are strong as daily MACD is in a large bullish crossover and all three major moving averages are on the rise. Even after Monday’s pullback to 83, CCI (149) is still in bullish territory. RSI is a stratospheric 78, although we may discern the beginnings of a negative divergence with respect to the previous high. The next level of resistance is likely the USDX 88-90 level which was last reached at the height of the meltdown in 2008. I would not be surprised to see those levels at some point, although the soonest that might happen would be June.
This week looks bullish to start as the Sun, Venus and Jupiter should exert a mostly positive effect on the natal Sun in the USDX chart. We might see a possible intraweek high Tuesday or Wednesday. Some consolidation is very likely later in the week as the Sun and Venus aspect natal Saturn. The overall outcome is harder to call this week owing to the possibility of some large moves. My best guess is the Dollar closes at or below its current level, perhaps near 85. Next week may see further consolidation but it may not be very much given Jupiter’s continued positive aspect to the Sun-Saturn conjunction in the natal chart. We could see a fairly important interim high made around June 7 as the transiting Sun aspects the natal ascendant while transiting Mars aspects Jupiter. I would then expect the Dollar to back off somewhat in subsequent weeks over June and July, perhaps towards the bottom of the upward price channel. But the final opposition between Saturn and Uranus is likely to cause more market jitters that should boost the greenback once again. By September, we could be at new highs for the year and then some.
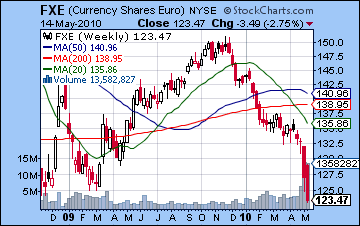 With its very existence called into question, the Euro collapsed under its key support level of 1.25 last week closing at 1.23. No amount of bailout money appears to be enough to stanch the bleeding at this stage as investors are shorting it aggressively. I was surprised by the speed of the decline as I thought we would only see 1.25 by June. What isn’t surprising is the recent extended down leg over the past several months as this has corresponded quite closely with the conjunction of Saturn (4 Virgo) to the ascendant of the Euro horoscope (5 Virgo). Saturn is rarely a positive influence in this position and the co-presence of Uranus in opposition has revealed major cracks in the entire Euro edifice. The technicals are about as bad as they come as prices have plunged below the moving averages and volume has increased on the way down. This week we are likely to see some more downside before it reverses higher. It might get down to 1.20 although that is not much more than a guess. I would expect a reversal by no later than Wednesday and the Venus-Uranus aspect which happens to fall on the natal angles. We could well see it reverse before that time, but the picture isn’t a clear one. With Saturn doing all the damage here, Jupiter’s opposition aspect should provide a lift to the Euro over the next two weeks. I would not be surprised to see it pop up above 1.25 again. Look for the Euro to slide again in early June as Mars enters Leo and the 12th house of loss in the natal chart. A lower low is possible here. Parity with the US Dollar is possible this year or early 2011. We could see some fundamental reorganization of the Euro in late 2012 or early 2013 as Saturn and Pluto will both impact the natal Sun. In the midst of all this currency turmoil, the Rupee went higher closing at 45.22. I had expected more weakness here, so it is possible it could avoid some of the selling pressure during this period of market turbulence. Some weakening towards 46 is nonetheless likely by early June.
Dollar
5-day outlook — bearish-neutral
30-day outlook — bullish
90-day outlook — bullish
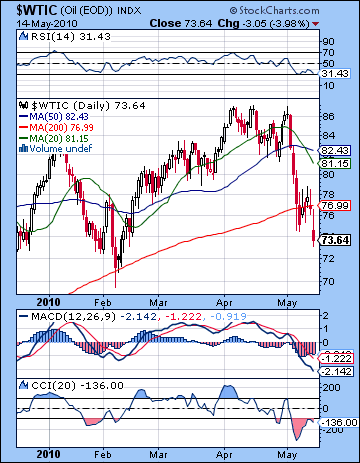 As global financial markets continued to gnash their collective teeth over the future of the Euro, commodities like crude oil got dumped on the way to the exits as traders sought greater safety. Crude extended its recent correction to close below $74 on the continuous futures contract. While I expected some downward thrust last week, I was mistaken in attributing much strength to the late week Sun-Venus aspect as declines accelerated at the end of the week. More puzzling was that the Venus conjunction to the ascendant in the Futures chart coincided exactly with Friday’s plunge below the 200 DMA. Right planet, right time, wrong result. The role of Venus here turned out to be a catalyst for the larger Saturn (4 Virgo) aspect to natal Rahu (4 Gemini). I thought we might have avoided the full brunt of that aspect until early this week but it was not to be. Nonetheless, we were not that far off in last month’s forecast for a significant low made near the end of the Mercury retrograde cycle on May 12. Depending on what happens this week, we may only be a couple days off the mark. The correction in crude has been substantial and is now 16% as prices have fallen from $87 in mid-April to $73. Since 20% is a round number for deep corrections, that figure may be in the back of some traders’ minds in the days ahead as the market searches for a bottom. Certainly, the technical picture is looking quite bleak as Friday’s rout pushed crude below its 200 DMA at $77. This is a critical support level which, if confirmed by a series of closes, would severely weaken any subsequent rally. At the same time, crude has not violated any previous major low around $70 so we may well see that tested early on this week. I would expect any decline we might see this week to bottom out at or above the $70 level. Daily MACD is predictably in a bearish crossover and CCI (-136) remains bearish here although it may quickly emerge from the depths with a solid up day. RSI (31) is perched near the oversold area and in fact may have made a double bottom with its flash crash low. One might be forgiven for cautiously interpreting that as a sign of incipient strength. If support is found around $70 now, resistance could well be the 200 DMA itself, now around $77. After that, the faster moving averages are clustering around $81-82. The convergence of these moving averages along with the close below the 200 DMA makes this correction more bearish than the January correction. We can envisage a situation where the 50 DMA may soon dip below the 200 DMA which would set off many alarm bells and herald another leg down. I don’t think we’re quite at that point but it is something to watch for in the weeks ahead.
This week is likely to extend the volatility from last week for another day or two with downside probing possible on both Monday and Tuesday, although with Tuesday perhaps a somewhat better candidate for a decline. With Mercury (9 Aries) now moving forward and away from the Moon-Saturn conjunction at 9 Libra, we should a gradual improvement in prices this week. Wednesday would be a good candidate for fresh gains as transiting Venus (5 Gemini) will aspect Uranus (5 Pisces) while forming aspects to both natal Neptune (5 Sagittarius) and natal Pluto (5 Libra). As Jupiter’s aspect to Saturn builds through the week, we should look for a firming up of prices into the weekend. It may be too much to expect a climb back to $77 but it should nonetheless make it part of the way there. The following week may see stable to weaker prices as Mars enters Leo and Saturn stations on May 30. June 1-2 is likely to see a significant pullback although there will be a bounce towards the end of the week. In all likelihood, it will consolidate around these levels and then attempt to move higher again. I don’t foresee an further weakening in June and July, although prices could begin to slide again in late July.
5-day outlook — neutral-bullish
30-day outlook — neutral
90-day outlook — bearish-neutral
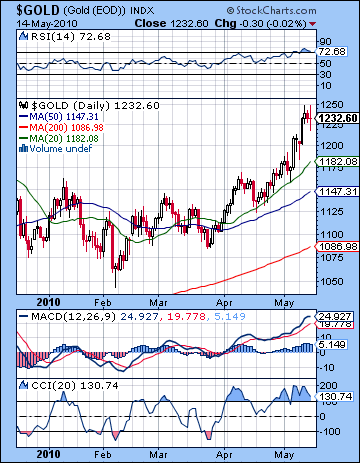 As financial markets assumed a state of high anxiety last week, gold’s safe haven appeal pushed it ever higher as it traded near $1250 before settling at $1232 on the continuous contract. It was a gain of 2% over the previous week and marked the fourth winning week in a row. This bullish result was largely in keeping with expectations as I had thought that the conclusion of the Venus transit to Taurus would provide support for gold. I also correctly noted a down day for Thursday among the overall bullish sentiment. I had forecast that gold might continue to head higher above $1250 into the Big Alignment this week and we may well get there yet. The bearish rising wedge that connects the previous intermediate tops in 2008 and 2009 culminates very close to current levels. Support in this pattern is still a fair ways off at $1150 which is very close to the 50 DMA at $1147. So a major failure of the wedge would not occur immediately, but gold has gone parabolic over the two weeks, and it may reverse at any time. Initial support would likely be offered by the 20 DMA at $1182 and the current gold euphoria would likely suffer a significant blow if it fell below this level. We cannot rule out higher highs this week perhaps to $1270 or even $1300 as there may be a fake out above the wedge resistance line. Otherwise, the technical picture for gold looks quite positive as daily MACD is in a bullish crossover and RSI (72) is very bullish peaking into the overbought zone after a series of steadily rising peaks. At the same time, the weekly chart shows significant negative divergences which may reflect the likelihood of a correction in the not-too-distant future.
This week looks very volatile for gold with further gains likely, although there may also be some significant down days in the mix. Monday will see the natal Sun (2 Scorpio) aspected by all of Jupiter (2 Pisces), Venus (3 Gemini) and Sun (2 Taurus) so it seems more likely to translate into gains. Wednesday will see Venus aspect Uranus in exact aspect to the natal ascendant, so we could see prices move higher into midweek also. But the late week period could be weaker as Mercury (10 Aries) opposes natal Mars (11 Libra). Since I am expecting stocks to stabilize as the week progresses, this bearish result for gold would be in keeping with its recent inverse relationship with equities. Gold looks increasingly vulnerable to declines thereafter as the Saturn direct station on May 30 will be in close aspect with the natal Sun and this could depress sentiment. Ahead of that time, Mars’ entry into Leo on May 26, the sign most associated with gold, might also be a negative factor. A steeper decline is more likely to take place in the first days in June after the Memorial Day holiday in the US. June 1 stands out in this regard as Mars will aspect Saturn on this day. Depending on what kind of slow bleeding we see take place in advance of the sharp decline, we could see gold correct down the 50 DMA at $1147.
5-day outlook — neutral-bullish
30-day outlook — bearish
90-day outlook — bearish-neutral