

- Stocks may gain going into Wednesday but outlook is uncertain around Saturn-Uranus aspect
- Dollar prone to declines until midweek then strengthen; unlikely to break above 82
- Gold choppy with further gains possible
- Crude likely to decline by end of the week
- Stocks may gain going into Wednesday but outlook is uncertain around Saturn-Uranus aspect
- Dollar prone to declines until midweek then strengthen; unlikely to break above 82
- Gold choppy with further gains possible
- Crude likely to decline by end of the week
Stocks added another 2% as the rally showed no signs of quitting amidst decent earnings reports and favourable real estate data. The Dow closed at 11,204 while the S&P pushed higher to 1217. This outcome was more bullish than expected and reinforced prices within the rising wedge for yet another week. While I had expected some upward lift here with Venus entering Taurus midweek, the absence of any decline at all Monday tossed out the possibility for a break below support levels. In last week’s newsletter, I noted that since the Sun-Saturn aspect was past exact by Monday’s trading, we could miss a good amount of any selling pressure. And then I alluded to a more bullish scenario: "Monday could see down open only to have the market reverse midday." That is more or less what happened as overseas markets bore the brunt of the bearish Sun-Saturn combination with losses in Asia and Europe. With the bearish planets out of the way, the bulls again took control of the market for most of the week with only Wednesday recording a modest decline. I had suggested that Wednesday was perhaps the most negative of the three midweek days but in keeping with the overall bullish tone of the markets lately, the decline was smaller than the gains on Tuesday or Thursday. Friday was particularly disappointing here as the approach of Venus towards its aspect with Saturn only pushed prices higher still. It seems the market wants to drive all the way to the top of the rising wedge at 1220 before pausing for any correction. Interestingly, this may end up corresponding fairly closely with the exact Saturn-Uranus opposition aspect that becomes exact this week on Tuesday, the 27th. In previous newsletters, I had wondered if we might see the market rise into the exact aspect and fall afterward, as had been the case in November 2008 and, to a lesser extent, in September 2009.
The rising wedge got another week of enthusiastic confirmation from investors last week as Friday’s gain pushed prices right up against a significant resistance level. As the rally climbs ever higher, it almost seems absurd to call it a "bearish" rising wedge. And yet, the pattern has enough negative baggage attached to it that it does not augur well for prices in the medium term. The key resistance trend line connects the tops dating back to late 2009 and if extended into June would see the S&P rise towards 1250. That is still a very possible outcome after we get some kind of correction here, although I would place the probability at 50%. It’s worth noting that the new highs for the year were achieved on good volume, which is a change from recent trading patterns. That may give bulls a little more confidence going forward. At the same time, we should point out that bearish rising wedges often culminate in brief surges in volume before breaking down below support. If we see another gain this week on strong volume, then that would tend to give more credence to the bullish case and increases the chances that the rally would be extended into June or perhaps July. While volume may continue to be strong next week, I don’t expect the S&P to rise much above the resistance line at 1220. Support is quite clearly near the 20 DMA, now at 1192. Every test of that line has so far rebounded higher, so we should pay close attention to any violations of that line on the downside. A break of that support line could well precipitate a sudden correction.
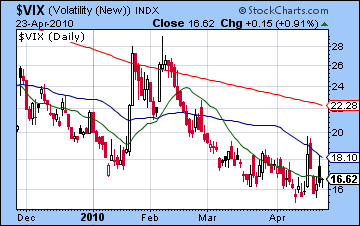
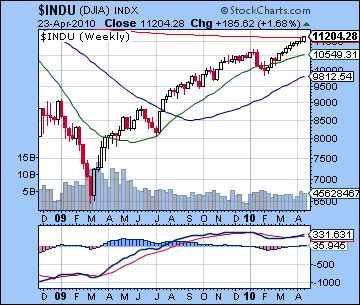 Daily MACD adds to the equivocal character of the current market as its flatlining now in a slight negative crossover. This does not mean prices can’t continue to melt higher here but it is not an indicator that gives one the impression of strong bullish sentiment. CCI (125) has climbed again above the 100 line but it is perhaps significant that it has yet to match the previous peaks. RSI (70) has now moved into overbought territory although it, too, is lower than in recent weeks. Given the higher prices, that is a potentially important bearish divergence. But it’s very much a complex technical situation here as the weekly MACD in the Dow chart still shows a small, if tentative, bullish crossover. One could say that there are straws to grasp on both sides of the investment divide. While I am generally persuaded by a bullish crossover in a weekly chart, it is hard to get too excited over this one because of the gaping bearish divergence here with MACD at lower levels than in January while prices have risen. The $VIX is holding steady above 16 suggesting that it may have bottomed here and thereby matching its historic lows dating back to the all time top in October 2007. On the other hand, we did see a new yearly high of 614 issues making 52-week highs last week and this is a positive reflection of the breadth of the rally. Bonds rallied also as the 30-year treasury index climbed back to 117. I think treasuries will continue to rise this week, perhaps at the expense of stocks. But the medium term outlook for bonds is quite bleak and this shows in the relevant horoscope also. Treasuries are unlikely to stay below 5% for the 30-year in the months ahead.
This week looks quite mixed as the Saturn-Uranus opposition aspect becomes exact on Tuesday. This may not precisely correlate with anything of note that day, although there is a reasonable chance it could approximately mark the high in this rally. A previous iteration of the Saturn-Uranus opposition marked an interim high in November 2008 so it’s possible we could see a repeat. Given the Sun-Mercury conjunction that occurs on Wednesday around 12.30 pm, we could well see the high occur then. As if to give added oomph to the conjunction, there will be a Full Moon on Wednesday. One possible scenario would be a weekly high made Wednesday morning with diminishing gains later on or perhaps even a reversal by the close. The week may begin bearishly, however, as a minor aspect between Mercury and Mars is close but separating by the open. Since this is past exact, it may not be that negative (i.e. shades of last Monday) but the Moon is in Virgo with Saturn so a flat to mildly negative outcome might be likely here. That said, I would not rule out a stronger sell-off. Look for prices to rise into Wednesday but weaken thereafter. At this point, we may well see 1220 on Wednesday on the S&P followed by bounce off of resistance into Friday. Friday is difficult to call as the Sun prepares to form its aspect with Mars. It’s still two degrees away, however, so it’s possible that most of the negative fallout from it will be reserved for the following week. Indeed, Friday’s Mercury-Venus aspect actually looks quite bullish, so we cannot rule out a gain at the end of the week, especially if Thursday has been down. If Monday is down as expected, then we could well finish at or below current levels by Friday.
 Next week (May 3-7) looks pretty bleak so I would expect some kind of correction to be in full bloom then. The Sun forms a near exact square with Mars on Monday and Tuesday while in simultaneous minor aspects with Rahu and Saturn. It’s hard to know what kind of decline we might see with this pattern. At a minimum, I would expect a 2% drop here in the early week period but it may well be more like 5-10% over a few days although that is very much a guess. These are tense aspects involving malefic planets and anything is possible. But I’ve consistently overestimated the downside of late so I’m loathe to make that mistake again. Nonetheless, this is a noteworthy configuration. Down days should strongly outnumber the up days here and I fully expect the 20 DMA to be broken and a possibility of testing the 50 DMA at 1154. The following week (May 10-14) should see the market turn around, especially on Thursday and Friday on the Sun-Venus aspect. The case for a reversal higher is strengthened somewhat by virtue of Mercury turning direct on Wednesday, May 12. After that, the market is likely to drift higher on the approach of Jupiter to Uranus but there will still be some troubling aspects to contend with. Mars enters sidereal Leo on May 26 so that is another change in energy that may interrupt any rebound. It’s unclear just how high stocks can go after this correction, although I think it will not be as smooth an incline as we’ve seen since the February low. While mostly bullish, the market may also be choppier.
5-day outlook — bearish-neutral SPX 1200-1220
30-day outlook — bearish SPX 1150-1200
90-day outlook – neutral SPX 1100-1250
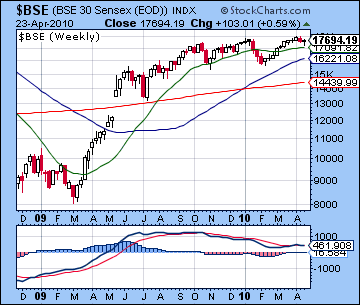
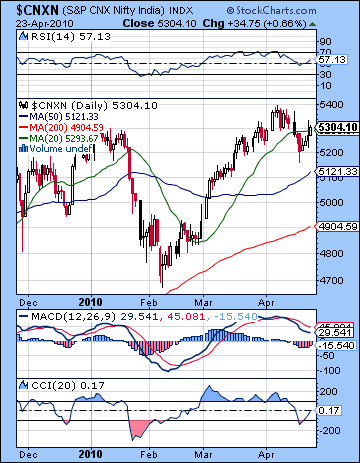 Stocks in Mumbai edged higher last week as the RBI raised rates only a quarter point and earnings continued to be respectable. The Sensex added less than 1% and closed at 17,694 while the Nifty finished at 5304. I had expected we would see more downside, mostly due to the Sun-Saturn-Uranus-Neptune configuration on Monday. While the market did tumble as predicted that day, the decline was only 1%. As a result, some of the other positive influences later in the week were enough to send the indices higher overall. Tuesday was higher as expected on the entry of Venus into bullish Taurus. The bullish bias continued for the rest of the week as Wednesday and Thursday also saw very small gains by the close, perhaps a reflection of the growing strength of Venus. I had expected more downside at the end of the week, however, but Friday saw a significant gain. I had been unsure if the Venus-Saturn pattern would manifest on Friday or wait into this week and it seems likely that any fallout from that aspect was put on hold. Last week’s rebound therefore undercuts the notion that the Sun’s entry into Aries would overload sentiment with unstable Mars-type energy. Similarly, the passing of the Uranus-Neptune aspect has not resulted in a significant weakening of prices. Neither of these developments comes as news, however, as I had noted that both were more diffuse, medium term influences that would act to accelerate any correction although they might not, by themselves, precipitate one. The Nifty is still below its high of early April so we will have to see how these influences play out. Interestingly, Mercury’s retrograde cycle started on April 18 has yet to demonstrate its effects as the market is only modestly higher. Given the trend was largely up in advance of the retrograde station, its retrograde cycle may yet see a significant reversal. Its current cycle completes on 11 May. One reason for the persistent strength of the market here may be attributed to the favourable circumstance of Venus in its own sign of Taurus (the bull!). While Venus transits this sign until 15 May, I would be very surprised if this single planet was strong enough to support prices until that date. Once the Sun approaches Mercury for its conjunction in Aries this week, we may see a focusing of the Aries/Mars energy that will be sufficient to offset any Venusian bullishness. That, plus the aftermath of the Saturn-Uranus opposition, should provide enough fuel for the bears to drop prices, at least temporarily.
The technical condition of the Nifty remains ambivalent. After trading off of lows of the 5200 support, prices rebounded so the rising wedge is still a going concern. This means that the market can continue its pattern of modest gains as long as it stays above the rising support line emanating from the February lows. This is currently around 5200 so any breaks below that level in the near term will cause more investors to question whether this rising wedge pattern has finally exhausted itself. Although it denotes a rally, the rising wedge is nonetheless considered a bearish pattern since prices can be subject to sharp declines once support is broken. The key resistance line in the wedge joins the most recent highs and now sits around 5400 or a little above. Any breakout above that line in the near term would form a very bullish signal since it would convince more technically oriented investors that this bearish wedge pattern had given way to a more sustainable bull market. Despite the late week rebound, daily MACD is still in a bearish crossover. This is quite a negative indicator and suggests that the rally may not have much conviction behind it. CCI (0) does not show any significant direction here although its recent brief visit to bear territory is not encouraging for bulls. RSI (57) is more bullish, especially given its rebound from the 50 line which might indicate future gains down the line. The Nifty currently sits on the 20 DMA so this is a possible crossroads indicating an imminent change. In the event of a pullback, the 50 DMA at 5121 might offer some temporary support although we should note that the January correction broke through the 50 DMA quite quickly. The 200 DMA at 4900 might offer stronger support if we see a more thoroughgoing correction. The MACD in the weekly BSE chart is still in a slight bullish crossover which does reflect a somewhat improved market condition from previous months. However, there is still a clear negative divergence here that ought to temper any overly bullish interpretation.
 With the exact Saturn-Uranus opposition occurring on Tuesday, this week offers the possibility of a significant turning point in the market. Monday begins with the tail end of the Mercury-Mars square aspect and the Moon in cautious Virgo. This may incline investors towards selling, although with the aspect past exact, we should not expect significant downside. And with the Saturn-Uranus aspect on Tuesday, we cannot rule out the possibility of higher prices around the time of the aspect. A Full Moon occurs on Wednesday just as the Sun conjoins Mercury, so that increases the likelihood for a gain then. One possible scenario would be for a bearish bias Monday and Tuesday that tests support at 5200 and then a gain Wednesday that takes the Nifty back near current levels of 5300. The latter part of the week looks more bearish, however, so we could see the aftermath from the Saturn-Uranus aspect manifest at that time. Thursday looks negative with the Moon in aspect to Mars while Friday is more of a toss up. The Moon opposes Venus in the afternoon, so that may be enough to generate some buying. If the morning is down, then a reversal higher is possible. The ultimate outcome of the week depends heavily on Monday and Wednesday. If Monday is down as expected and Wednesday posts a sizable and largely offsetting gain, then the Nifty could finish within the wedge, between say 5250 and 5350. The absence of any significant decline on Monday could well push prices towards resistance levels of 5400 at some in the week. All things considered, I think a neutral outcome is more likely with significant downside risk over the next two weeks.
Next week (May 3-7) features an exact Sun-Mars aspect on Tuesday that has the potential to take prices down significantly. While this aspect is bearish on its own, it will be part of a larger alignment of Saturn and Rahu. Since these are malefic planets, we could see a dramatic negative shift in sentiment. A breakdown of the rising wedge is more likely to occur at this time than any other. I would definitely not rule out a test of the 200 DMA at 4900 also by Friday, 7 May. The following week (May 10-14) should see some rebound occur by the end of the week on the Sun-Venus aspect. This is very unlikely to bring prices back to where they were, however. We should see another significant rally attempt in May, however, as Jupiter approaches Uranus. Normally, this would be an unequivocally positive influence but its effects may be somewhat muted this time since these benefic planets will be opposite Saturn. While I would still expect a bullish bias in the second half of May, it may still be a fairly choppy market. As before, we will likely see another significant correction occur starting in late July.
5-day outlook — bearish-neutral NIFTY 5200-5350
30-day outlook — bearish-neutral NIFTY 4900-5100
90-day outlook — neutral-bullish NIFTY 5200-5500
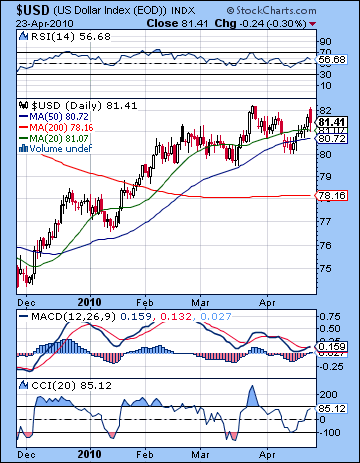 Taking advantage of further worries over Greece and the Eurozone, the Dollar rose last week closing at 81.41. I had been uncertain about last week given the range of possible interpretations for the key aspects. I had noted the possibility of a run-up to resistance at 82 and indeed Friday’s open started at that level and then fell from there. Monday was flat, perhaps reflecting the offsetting influences at work. I had expected gains to be more likely towards the end of the week on the Venus influence to the natal Sun in the USDX chart and indeed Thursday was the biggest up day and Friday saw a positive open. The Dollar retreated after that demonstrating the importance of the 82 resistance level. The technical situation is somewhat cloudy here as daily MACD is only barely broken into a bullish crossover. A clear negative divergence remains, however, so one should not get too excited about this chart. Even with last week’s gain, CCI (85) is still below the bullish line suggesting possible weakness down the road. RSI (56) has also turned higher but needs to climb back to (70) in order to offset the bearish indication of the recent lower low. While prices have broken below the rising support line, the 50 DMA did offer some support last week. Prices have thus rebounded from this moving average and it may be significant support going forward. The bullish case was also given more evidence last week since the lows were at a higher level than the previous lows of 79.5. This leaves intact the series of higher lows that is important in a bull market rally. Since the Dollar can no longer boast higher highs just yet, the lows become more important in maintaining the bullish case. Resistance is still at 82 and it may take the Sun-Mars square on May 3-4 to finally break above that level.
This week looks mixed as some of the early to midweek patterns may not favour the dollar. Monday and Tuesday will see Mercury conjoin the natal Rahu in the USDX chart. This is often a destabilizing effect that increases the chances of declines. The Sun-Mercury conjunction will occur just one degree from this natal Rahu and that points to the possibility of a large move. Again, Rahu is an unpredictable planet so we should not expect gains to occur while at the same time not ruling them out completely. Thursday and Friday look more bullish as transiting Venus will aspect the 10th house so some recovery is likely then. Overall, I would expect any bearish trend to push prices down below 81 with any late week rally to bring them back towards their current levels. Next week the situation should brighten for the Dollar as Venus approaches an aspect with Mercury. I would expect the best chance of the Dollar to break through resistance to occur at this time. On the whole, May should be more favourable than April was with probable higher highs.
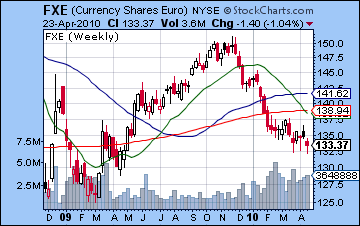 As Greek bailout concerns continued, the Euro suffered another down week closing below 1.34. This was largely in keeping with expectations given the predominance of the Sun-Saturn aspect in the Euro’s natal chart. Prices fell for four straight days before rebounding somewhat on Friday. I thought we might see more of a midweek rebound but strength returned only on the close Venus aspect to the ascendant. The technical situation looks quite uncertain now since a recent rally attempt failed to break above the 50 DMA. On the other hand, prices did not fall below 1.33 so there is the possibility that a double bottom has formed here from which gains may be extrapolated down the line. I still don’t expect gains in the near term, but the technical indicators do offer some hope to bulls. Volume saw a modest increase last week, which is a bearish signal given the fall in prices. This week lacks any clear planetary driver so calling an outcome is especially difficult. The Saturn-Uranus opposition lines up right along the ascendant so that has the potential to shake things up considerably. Wednesday’s Sun-Mercury conjunction is likely to increase risk appetite so the Euro should enjoy some benefit there. With next week’s difficult Sun-Mars aspect, the Euro is still facing an uphill battle. I would not rule out 1.30 at that time. Meanwhile, the Rupee advanced to 44.35 last week as the RBI rate increase of a quarter point may have provided the right amount of tightening. While it could remain fairly stable this week, it is likely to move back to 45 by next week.
Dollar
5-day outlook — bearish-neutral
30-day outlook — bullish
90-day outlook — neutral-bullish
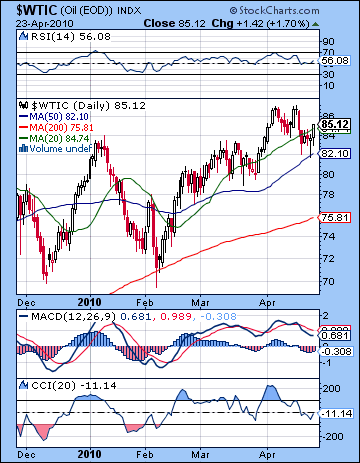 As demand data continued to show growth, crude moved higher last week again closing above $85 on the continuous contract. I had expected a pullback on Monday’s Sun-Saturn aspect and crude mostly cooperated as prices fell as low as $82. We also saw prices rebound somewhat into midweek as Venus entered Taurus. More surprising, however, was Friday’s surge back over $85. While it fell within the expected range, I thought most gains would have been confined to the midweek period. The technical situation of crude seems vulnerable here as daily MACD has moved into a bearish crossover. CCI (-11) appears to be drifting lower although it should be noted that the low point here matches a previous low. This may reflect some measure of implied support here. RSI (56) is more strongly bullish as it has managed to remain above the 50 line with each of its smaller pullbacks that have followed the February low. Resistance is likely found at the previous high around $87 and after that around $92. Support is likely near the the 50 DMA at $82 which was successfully tested last week. Below that, the 200 DMA may provide a more crucial level of support at $74. The February correction tested that level and if early May turns out to be negative we could well see that line tested again.
This week looks fairly mixed with gains more likely from Monday to Wednesday perhaps and then weakness moving in towards the end of the week. While Monday does not look especially positive, there is a chance that there will be a positive bias until Wednesday morning and the Sun-Mercury conjunction. After that, crude may turn bearish. It is also possible that we could see only one or two big up days with declines mixed in between. I would lean gently towards a bearish outcome by Friday. Next week looks more bearish still on the Sun-Mars square so whatever declines we don’t see this week, we will see next week. A break below $82 seems inevitable here with $74 a distinct possibility. A significant rebound is likely by May 13-14 when Venus will cross the natal ascendant. The following Monday the 17th may be more difficult to ascertain as there will be a major alignment of Sun, Venus, Jupiter and Saturn. Assuming we correct significantly here, we could see more gains through June and much of July as prices trade between $75 and $90.
5-day outlook — bearish-neutral
30-day outlook — bearish
90-day outlook — neutral
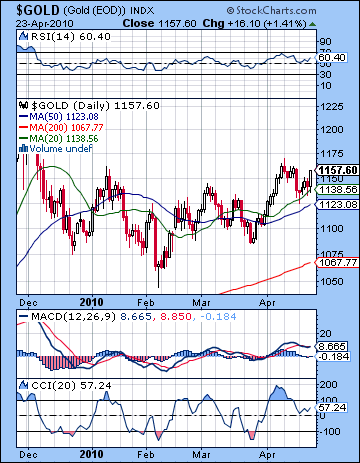 As fears around Greece’s debt problems continued to swirl, gold added 2% last week closing at $1157. this was very much at odds with our forecast as I expected more downside from Monday’s Sun-Saturn aspect. While Monday was lower, prices bounced back off their worst levels before the close and ended only modestly down. As expected, gold trended higher midweek on the entry of Venus into Taurus and some favourable aspects with the ETF chart. I had thought we would see more weakening late in the week and while Thursday was lower, it was only modestly so. Friday’s gain was very surprising as the Sun conjoined malefic Rahu in the natal chart. One possible explanation for the rise was the bullish alignment between Mercury, natal Jupiter and natal Neptune. While it was a minor aspect, it was nonetheless a positive influence that I underestimated last week. Despite gold’s rise, its daily MACD has slipped into a bearish crossover. CCI (57) is trying to move higher but is not quite in bullish territory. RSI (60) is again rising and perhaps most significantly bounced off the 50 line suggesting general bullishness. Friday’s gain pushed gold back to its recent highs around $1160 so that will be an important resistance level here. Support may be found near the 50 DMA at $1123. This line also roughly corresponds with the rising trend line off the February low. Below that, the 200 DMA at $1067 could be a medium term support level. Significantly, this line sits at approximately the same level as February low. We should also make some mention of volume trends on the popular GLD ETF. While Friday’s gain was impressive, volume was only average. If it was the start of a bigger move higher, one would have expected more volume. Weekly volume was actually below average and below recent weeks in which prices declined.
This week looks potentially choppy for gold as Wednesday’s Sun-Mercury conjunction is likely to spark a gain. Aside from that aspect, the outlook is less certain and less positive. Monday sees the Moon in Virgo with Saturn which may make gold less attractive. Tuesday’s Saturn-Uranus aspect occurs with the Moon in Libra. This sets up a possible contact with Venus that could offer some support. Wednesday is likely higher, at least into midday on the Libra Full Moon. Thursday looks less positive, however, as the Moon enters Scorpio where it is debilitated. This placement may therefore weaken prices as the Sun-Mars aspect is invoked. Friday has the chance for gains on the Mercury-Venus aspect and this is perhaps even more likely given the Moon opposition to Venus. It is quite possible that gold could actually trade above current levels at some point this week, although much will depend on any pullback we see early in the week. Therefore, one scenario would be gold trading in a range between $1130 and $1160. But given the strong likelihood of a gain near the Sun-Mercury conjunction, it is still conceivable that gold could trade above $1160. The weakening of the Sun may only become more apparent next week, however, so gold should begin to tumble then. Mercury’s direct station at 8 degrees of Aries occurs on May 13 and this may well mark an interim low. I would not rule out a test of $1067 by that time. Gold may be range bound after that with further declines more likely in July.
5-day outlook — neutral
30-day outlook — bearish
90-day outlook — bearish-neutral