

- Stocks weak early in the week and then rebounding
- Dollar to rise early, perhaps to 82
- Gold subject to selling
- Crude weak with choppiness early with gains more likely later
- Stocks weak early in the week and then rebounding
- Dollar to rise early, perhaps to 82
- Gold subject to selling
- Crude weak with choppiness early with gains more likely later
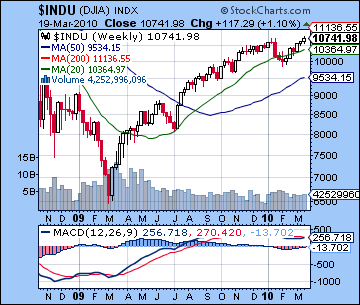
The bear market rally continued for another week as stocks rose on a pledge by Ben "Bubbles" Bernanke to keep interest rates low indefinitely. The Dow made new highs for the year and rose 1% to close at 10,741 while the S&P closed at 1159. While the run-up into midweek was expected, the absence of much selling on Thursday and Friday was disappointing. The Sun-Mercury-Uranus conjunction came off more or less as predicted as stocks rallied back strongly after Monday’s initial sell-off. Tuesday and Wednesday were both solid up days and coincided nicely with the Sun-Uranus conjunction, although I thought its bullish influence might wane by Wednesday. The fact that it didn’t and prices continued to rise is evidence that the medium term trend is somewhat stronger than I had expected. Thursday finally saw some caution invade the market as the Mercury-Saturn aspect perfected. Unfortunately, this produced only the most marginal of pullbacks. Friday was the bigger down day, although buyers came in near the close and pushed prices up off their worst levels. While I was more or less correct on the intraweek dynamics, this market is much more bullish than forecast. We can see that the Saturn aspects are influencing outcomes since the market tends to stop its rise, but it is not producing the kind of pullback one would expect. This is a testament to the enduring strength of the Jupiter-fueled rally and one wonders what constellation of planets and aspects will be necessary to knock it from its lofty perch. I still believe we are (over)due for a corrective phase here, but lack of any significant selling on these apparently bearish Saturn aspects is cause for some concern. It increases the possibility that the market could bounce even higher after we get some kind of correction. SPX 1250 by June therefore should be considered a real possibility after more consolidation. I would still say that 1250 is not the most likely scenario, but its probability is increasing.
Technically the market took a major step forward as the S&P made new highs for the year trading as high as 1170 on Wednesday. The Dow also made new yearly highs Thursday although it closed close to its early January prices. While volume did not enthusiastically confirm these highs, bulls could nonetheless make a better case for staying long in the market. Bears may counter will the fact that the new highs were made on lower than average volumes, a possible sign of narrowing interest. By contrast, the key breakout rallies of 2009 occurred on higher than average volume and were therefore more sustainable. Daily MACD on the SPX is still in a strong bullish crossover although we can discern a slight narrowing of the gap. For the bulls, however, we should observe that MACD levels (16) are appropriately higher than they were for the January high, so that confirms the notion that the rally might be on more solid footing. CCI (98) has just slipped below the bullish zone although it is close enough to 100 that it could been seen as bullish confirmation. RSI (69) has dipped below the overbought area and looks more suspect, as if it may well be headed lower. Offering more evidence for current strength, the 20 and 50 DMA are in a bullish crossover. Weekly MACD in the Dow chart is still negative (-13) although that gap has narrowed significantly in past weeks. Although the recent rally has been relentless, its inability to reverse the fortunes in the MACD gives more consideration to the bearish case. Resistance can be found following the upper rising price channel around SPX 1190. Support may be found around 1110-1130, close to the 50 DMA and roughly near the initial top after the early February low. Below that, we would expect new buyers to come in near the 200 DMA at 1020-1050, with previous October and November lows giving additional support at or near that level. Overall, the technical picture leans towards the bulls, although with some important caveats. This market seems priced for perfection and it may be vulnerable to any unexpected development, either at home or abroad.
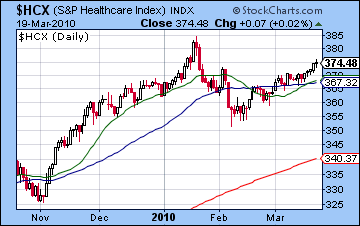
 One such development may be the successful passing of the Obama administration’s health care bill on Sunday. Although unpopular, there is a growing realization that the Democrats have the votes to get it through. Some commentators have suggested that this will be negative for the market because its high cost will put an upward pressure on taxes in the medium term and therefore will be detrimental to job creation and the economic recovery. But the question is: has the market already discounted this outcome? Part of Friday’s decline no doubt reflected some of the uneasiness about the economic implications of Obamacare, suggesting that perhaps some of the discounting may have already taken place. A look at the S&P Health Care Index ($HCX) reveals that it has failed to keep pace with the rally since making its January highs. This is another clue that Sunday’s vote may be less negative for the market than some people think, especially since it bucked the overall market trend lower in Friday’s session. On the other hand, a bearish case could be made that it is merely ripe for further selling since it is now more vulnerable to shorts. I would also note that Monday’s planets are looking quite powerful given the alignment between Sun, Mars and Saturn. While it is certainly possible this could represent more upside, I think the most likely interpretation of these planets is a decline. Plus, the long bond climbed higher last week as the 30-year matched its highs for 2010 as it traded over 119. This also offers a little more evidence that bonds could be positioning for a move higher to 123. Such a move would generally accompany a sell-off in equities.
 As mentioned above, this week begins with a potentially big aspect — Sun opposite Saturn in minor aspect with Mars. At the risk of sounding like a broken record, this combination has the potential of taking the market down significantly. Up to now, these types of aspects have failed to generate much downside at all, perhaps due to some residual Jupiter influence or perhaps due to the offsetting proximity of Uranus to the faster moving planets. The close aspect of Uranus and Neptune is another potential reservoir of bullish energy that warrants our attention. Tuesday also has the possibility of being negative since the Sun will sit at the midpoint of the Saturn-Pluto square. A morning rally on Wednesday is possible on the Moon-Venus square, although it is unclear if this will be enough to push the indexes into the green. Thursday may be somewhat more positive on the Moon-Sun aspect that forms an alignment with Pluto, although there is a chance the market may peak early and weaken somewhat by the close. Friday looks more negative again on the Mercury-Rahu square, although perhaps only modestly. Generally the late week period could be net positive, but if we see a big sell-off early on, then it may not be enough to rebound back to current levels. Overall, I would lean towards a negative outcome here, mostly on the possibility — both astrological and real — that the health care bill creates significant negative sentiment to compel enough investors to take profits.
Next week (Mar 29 – Apr 2) could well begin bullishly as Venus sets up very sweetly in aspect to Uranus and Neptune on Monday. Mercury echoes this alignment on Tuesday and Wednesday so stocks should be net positive by Wednesday but Thursday and Friday could be significantly negative as Venus forms an aspect with Saturn. Friday looks the worse of the two as Mars will square Venus while Mercury will be in quincunx with Saturn. It is hard to say if the week will be net negative, but it is certainly possible. The following week (Apr 5 – 9) begins on a negative alignment between Mercury, Mars and Pluto but will likely rebound higher as the Sun forms an aspect with Jupiter by the end of the week. Prices should generally weaken or move sideways through mid to late April so we should see a bottom formed sometime between April 15 and Apr 30. In previous newsletters, I had suggested the market would stay weak until mid-April. I would now lean towards weakness lasting for a little longer, perhaps as late as April 30. A more significant rally is likely after that and could well continue into June. It is difficult to say how high it could go, but it is not unreasonable to expect a 20% rally assuming that we have a decent sell-off beforehand. As before, the summer looks more problematic with the likelihood of steeper declines in the fall.
5-day outlook — bearish SPX 1110-1150
30-day outlook — bearish SPX 1000-1050
90-day outlook — neutral SPX 1100-1200
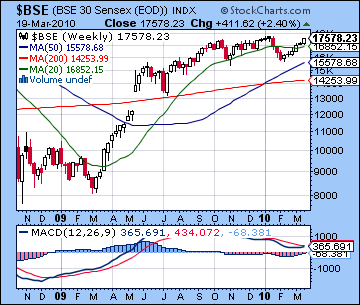
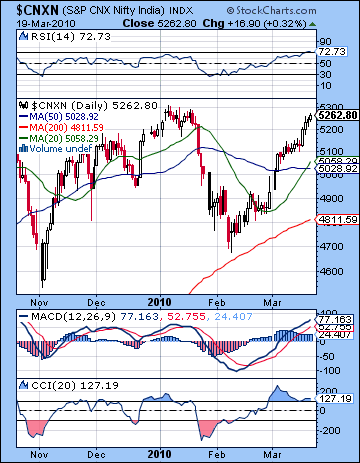 Stocks in Mumbai moved higher last week as prospects for India’s recovery continued to impress both foreign and domestic investors. The Sensex gained more than 2% to close at 17,600 while the Nifty finished the week at 5282. While I had expected a rally into the midweek period, the failure of the Mercury-Saturn aspect to deliver any pullback late in the week was disappointing to say the least. Certainly, the Sun-Mercury-Uranus conjunction looked positive in advance and this played out roughly as forecast as we saw solid gains on Tuesday and Wednesday. I had mistakenly thought Monday would be bullish but the effects of the conjunctions played out a little later than anticipated. More worrying was the tenacity of the bulls to take prices ever higher, all the way into Friday. While the gains were more modest than earlier in the week, it is hard to fathom how such a clear Saturn affliction could correspond to stable or rising prices. No one has ever said astrology was a simple science. At the same time, sentiment did turn very bearish after Friday’s close on the surprise rate hike by the RBI. This act of tightening sent global markets lower on Friday as investors feared it could lead to an end to the era of easy stimulus money and with it, the foundation of this monumental bear market rally we have witnessed in the aftermath of the Great Recession of 2008. Overall, last week’s rise did not offer strong confirmation that Saturn would soon be ruling the roost as the Mercury aspect was largely a non-event. This does not mean that a trend reversal is not possible or imminent, but it does mean the residual bullish energy may take longer to unwind and moreover, it may prove to be more resistant to selling than I thought. A correction is still the most likely scenario in the near term, but any post-correction rebound could well go to higher levels by June.
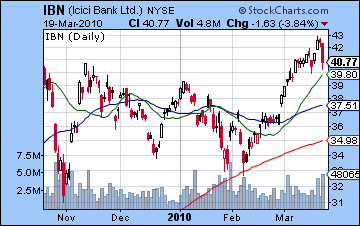
Even with the advance, the market remained stuck in a technical twilight zone, albeit with a rosier hue. Bulls took prices all the way to the rising upper trendline to 5250 and even a little above it, but could not make new highs above 5300. This may not be a critical failure for the bulls, of course, but it does not do enough to bring in new money from the sidelines. Indeed, the resulting double top formation may scare some bulls to take profits here and thereby embolden bears. The daily MACD for the Nifty is still in a bullish crossover indicating positive momentum. We should also note that its current level (77) exceeds the high made in January and therefore is another sign of strength. CCI (127) is similarly bullish but RSI (72) may be showing some indications of topping. Previous highs correlated with touches at 70 and this time around RSI has risen a little past that level. The weekly MACD on the Sensex is still in a bearish crossover despite last week’s gains. A breakout higher above the January highs would likely correspond with a crossover on the weekly MACD chart and would be a powerful signal for bulls. This seems quite unlikely, however, and we should remain skeptical until that outcome actually comes to pass. The rate hike greatly increases the probability for a pullback early next week and we can see what degree of selling is possible on the ICICI chart for the NYSE (see IBN). In Friday’s session, it fell almost 4%. So in the event of a decline this week, we could see some support around 5050-5100, which roughly corresponds to the 20 DMA. Beyond that, the 200 DMA around 4800 could halt any decline and bring in more buyers, especially since it matches a rising channel from the July lows.
 This week begins with another Saturn aspect as the Sun lines up in opposition. At the same time, Mars will form a minor aspect with both of them. In the past, this sort of three-way syncopation of planets has sometimes led to higher prices. I suspect there is less chance of that here since two of the planets, Mars and Saturn, are natural malefics. Both Monday and Tuesday are candidates for declines, although Monday stands out more due to the closeness of the Sun-Saturn aspect. However, I would not rule out some kind of rally attempt near the close Monday as there is a weak Moon-Venus aspect. On Tuesday, the Sun moves past Saturn a bit and the Moon enters tumultuous Ardra so this would tend to create bearish conditions. Overall, the market should be net negative over the first two days of the week before Wednesday’s holiday closing. I would not rule out a test of 5000 here, although that may be a stretch given the recent strength of the market. The late week looks more promising with a net positive result likely. Thursday sees the Sun approach a tense square aspect with Pluto while the Moon conjoins Mars. This combination of influences may increase urgency in trading and make for higher than normal volume. In addition, the affliction to the Sun should be seen as potentially negative for state-related shares. But Venus is in late Pisces here approaching a favourable position in the NSE chart so we should expect at least one up day, with Friday looking somewhat more likely than Thursday. It seems unlikely that both days will be positive, however, and watch for a weaker close on Friday. Overall, there is still a plausible case for a significant pullback this week. Even with the prospects for some kind of rebound, a negative outcome is the most likely scenario based on the planetary influences.
 Next week (Mar 29 – Apr 2) looks like it will begin bullishly as Mercury crosses a favourable point in the NSE chart and Venus forms a nice pattern with Uranus and Neptune. This could be a sizable gain that extends into midweek. Weakness will return by late week, however, as Venus forms a minor aspect with Saturn. This week could well be net positive, however, so I am assuming it will follow up some significant selling and thus will not mark new highs. We shall see if that view is correct. The following week (Apr 5-9) looks more negative although it could begin positively. The rest of April looks neutral at best, with the probability of some significant downside moves. Indeed, it is quite possible the market will stay bearish until the last week of April when Mars is in aspect to both the Sun and retrograde Mercury. By contrast, May looks much more bullish so a sizable rally is likely that could extend into June. Possible end dates for the rally could be June 1 and the end of the Saturn retrograde cycle, or perhaps June 8, when Jupiter finally conjoins Uranus. I think we should expect at least a 10% rise off any lows that are made in April and perhaps 20% if the correction is deeper. The summer period seems weaker generally with the possibility for larger declines growing as we move into fall.
5-day outlook — bearish NIFTY 5000-5200
30-day outlook — bearish NIFTY 4500-4800
90-day outlook — neutral NIFTY 5000-5500
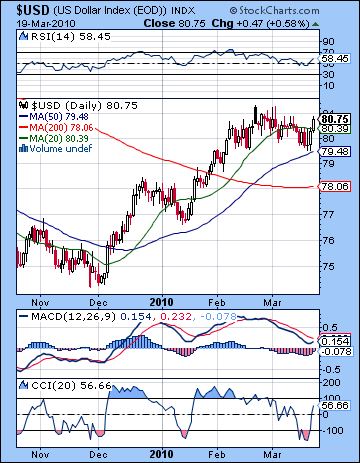 As inflation fears increased the likelihood for rate tightening around the world, the Dollar rebounded towards its recent highs just under the 81 level. This bullish outcome was in keeping with expectations as the predicted weakness from the Sun-Uranus conjunction manifested into Wednesday and pushed the Dollar lower. But the Mercury-Saturn aspect late week generated more risk aversion and pushed up prices sharply. At its lowest point this week, the Dollar still traded above its 50 DMA, a sign of its residual strength that has been building since December. It also managed to stay above its rising upward channel of support thus giving bulls further encouragement to stay in the game. Daily MACD is still in bearish crossover, however, although it is showing signs of reversing. CCI (56) has moved into positive territory now and may well enter the bullish zone above 100 with another day’s gain. This technical indicator may in turn generate more buying in the short term. RSI (58) has turned higher after forming a potential bottom just below 50. The weekly RSI (62) is also bullish and may well have further to go before it tops out. Weekly MACD is similarly still in a bullish crossover and offers more evidence for our view that the Dollar is in a medium term rally. Resistance remains the key question for the Dollar here as the 81-82 level is proving to be formidable. We will likely see this tested early this week on the Sun-Saturn opposition although the prospects for breaking above it are not at all clear. I would not rule out a stunning rise here, a sort of leapfrog over 82 but the equity rally has been stronger than expected so we should be more cautious. Above that, 83-85 would be the next level of resistance. Support is around 79.5 and the 50 DMA and we should be careful that that level is not breached. Last week’s trading came quite close and a breach could trigger a sudden drop. I don’t expect this to happen but the 50 DMA is shaping up to be a key level of technical support.
This week inclines towards the positive on the Sun-Saturn aspect early in the week. With Jupiter still aspecting both Mercury and Venus in the natal chart, there is good reason to be optimistic of further rises. The late week may see a pullback as transiting Mercury opposes the natal Mars (esp. Thursday) but this is likely to be a fleeting influence. Transiting Mars is still within range of the ascendant, however, so it remains to be seen how this may interfere with the otherwise bullish planetary proceedings. The Mars factor here means that we cannot completely rule out a reversal lower, although this would seem fairly unlikely. But the unusually high number of planets in aspect here increases the chances of a larger move, presumably to the upside. Next week also looks generally positive as transiting Jupiter is still within range of its aspects to the ascendant and Mercury. I am less certain the rally can continue as we move into April, however, as there are conflicting astrological signals. I would lean towards higher prices generally, but it is unclear how much more headway the Dollar can make. May looks more clearly bearish as the transiting Saturn aspects the natal Sun. This is likely to produce a sizable correction so we are likely going to lose a significant chunk of the run-up, perhaps as much as 50%. If the Dollar goes to, say, 84 in a best case scenario, then that would amount to a correction down to 79. The correction is unlikely to last through the whole month of May and we should see buyers return in force before June. There is a good chance we will new yearly highs made in the summer. I am expecting another major rally to occur in August and September that could well match the highs of 88-90 that we saw in 2009.
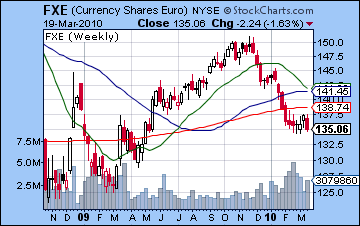 As expected, the Euro tumbled again on worries that the IMF may have to be called in to save Greece. After a brief rally early in the week of the Sun-Uranus conjunction, the Euro again fell below 1.36 and was last seen heading towards its recent lows below 1.35. The Mercury-Saturn aspect along the ascendant axis of the Euro’s natal chart delivered the losses more or less on schedule late last week as Saturn’s protracted visit to the ascendant is proving to be every bit as bearish as we expected. Technicians may look at the Euro’s inability to break above the falling trendline from the December highs and pronounce it "bearish". After two weeks of gains on slackening volume, last week’s decline came on high volume, another sign that the sellers have the upper hand. This week the Sun-Saturn opposition occurs very close to the natal ascendant of the Euro. This does not seem to be a positive influence and could well produce a large decline since the Sun rules the 12th house of loss in the Euro chart. To make matters worse, transiting Venus opposes natal Mars early in the week so by rights we should see the Euro fall here, perhaps to new lows for the year. Some late week gains are very likely, however, as Venus is aspected by natal Rahu. Overall, the Euro should be lower with the outside possibility of 1.33. At this point, the Euro should stay weak and below the falling trend line until at least mid-April, if not late April. There is a bullish Jupiter to Jupiter aspect around April 20 but it is unclear if this will usher in a new rally that extends into May or merely produce a couple days of gains. The Rupee was mostly flat last week as it closed Friday at 45.5. The rate hike prompted some overseas buying on the prospect of higher rates although the rise may have been muted due to the safe haven move into the Dollar. This week is harder to call as possible early weakness may be offset by late week rebound. A bearish bias may be the most likely outcome.
Dollar
5-day outlook — bullish
30-day outlook — bullish
90-day outlook — neutral-bullish
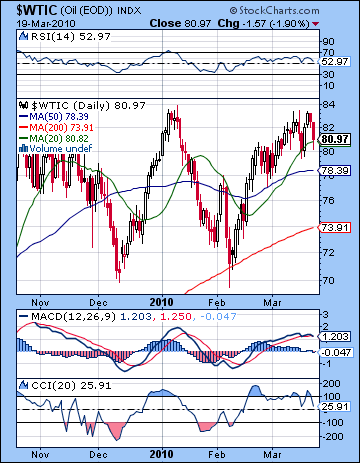 As predicted, crude oil fell last week as the strengthening Saturn influence made investors more risk averse. After another mid-week rally attempt that pushed it to $83, crude finished below $81 on the continuous contract. While the overall outcome more or less followed expectations, some puzzles emerged along the way. Monday’s decline was not in keeping with the transiting planets, although we could summon an explanation by reference to the futures chart where the natal Mars was activated by transiting Mercury. We had not expected a big drop here in any event, perhaps as a reflection of the ongoing strength of the Jupiter-Uranus conjunction at the top of the chart. The technical picture worsened for crude last week as the daily MACD is now in a negative crossover, and has a negative divergence to boot. CCI (25) looks a little pale also, although it slipped down to similar levels (but above zero) last week and staged a temporary comeback above the 100 line. RSI (52) is falling again after failing to reach 70 on its recent rally. This is perhaps more evidence that it has further downside. From the bullish perspective, it is important that it stays above 50 which would match previous lows before attempting another rally. If it falls below 50, then there is a greater chance it will go all the way down to the 30-35 area. Volume on the USO ETF does not offer any significant indications either way, as volume on down days does not greatly exceed that of up days. Resistance is still the previous top around $83-84 and the failure to break above that level last week may weigh upon the minds of bulls here. Support is likely found around the 50 DMA near $78. Below that, the previous lows of $70-72 and the 200 DMA ($73) should bring in new buyers in the event of any major down move.
This week presents some conflicting evidence since the transits appear bearish in the early week but the natal chart shows signs of positive sentiment on the Mercury to Jupiter aspect. The transits look negative as the Sun-Mars-Saturn alignment is mostly bearish and could worsen sentiment early in the week. By contrast, the futures chart offers an apparently bullish Mercury aspect to natal Jupiter that ordinarily would produce at least one reliable day of gains. With Monday looking pretty bad, it’s possible we could see a significant sell-off Monday followed by a rebound on Tuesday. Look for gains to become more likely as the week progresses as transiting Venus will conjoin the natal 11th house (gains, income) on Thursday and Friday. I would not be surprised to see an up week overall here, although I think the bias is more likely negative, if only due to the force of the transiting planets. Next week looks more bearish as transiting Mars will square the Moon-Saturn aspect, although we will see at least one or two positive days, with Wednesday looking the most likely. Friday April 3 may be the most bearish day of the week. While prices will likely stay weak well into April, there is a good chance for a rally going into May as Jupiter will become very strong in this chart. Monday, April 26 may be significant as there will be another Saturn-Uranus opposition, the third of a total of four in this series. This is likely to increase volatility given it will form an exact aspect with the natal nodes.
5-day outlook — bearish-neutral
30-day outlook — bearish
90-day outlook — neutral
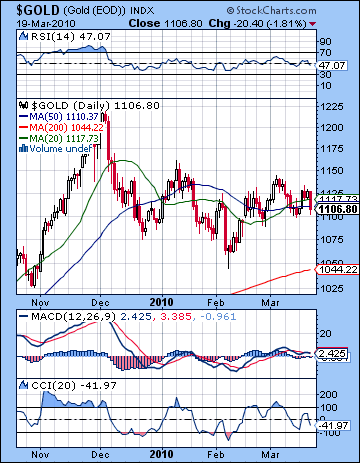 After running up to $1130 midweek, gold closed little changed on the week at $1106 on the continuous contract. This outcome was largely in keeping with last week’s forecast as the Sun-Uranus conjunction took prices higher early in the week with Tuesday’s session being the big gain and the intraweek high made on Wednesday. This was a nice confirmation of the Sun’s role as significator for gold since it made its exact conjunction to Uranus early on Wednesday. The subsequent decline therefore coincided with with the separation of this aspect and the bearish Mercury-Saturn aspect. The technical condition worsened somewhat last week, although bulls may take some solace in the fact that prices remained perched on the 50 DMA. This has been a legitimate support level since mid-February and will likely to offer occasional support to any rallies in the future. However, daily MACD is in the slimmest of bullish crossovers and is falling. CCI (-41) does not show any indications of turning higher, although it can still be seen as neutral. RSI (47) has moved into bearish territory now although it, too, should be seen as equivocal at this point since no clear divergences are evident. But volume increased sharply in Friday’s sell-off and was even greater than Tuesday’s run-up. The bias towards larger volumes on big down days is another clue that more gold bulls are choosing to take profits on dips rather than add to their positions. The weekly indicators are still bearish in terms of momentum, but it should nonetheless by noted that MACD and RSI are still in bullish territory thus reflecting the huge run-up in gold in recent months. Resistance appears to be quite strong around $1130 as the midweek rally failed to make it to previous highs. This level roughly matches the rising trendline off the October 2008 lows. So in classic bearish fashion, it appears as if support has now become resistance. After the 50 DMA around $1100, we could see more support come in around $1070 which coincides with the rising trendline from the April lows. Below that, the 200 DMA around $1000-1020 would be the next resistance level.
This week could be critically important for gold since the Sun-Saturn opposition should take prices lower, perhaps to the next support level. One potential problem with this thesis is that the exact opposition actually occurs well before the market opens so some of the bearishness may have dissipated by the trading session. If for some reason Monday is not lower, then we could see bulls prevail over bears this week. Friday stands out as offering a good chance at a sizable gain as Venus conjoins the 4th house cusp in the natal chart. If Monday is higher and the week is higher, gold may be able to hang onto the 50 DMA and trade between $1100 and $1130. I don’t think this is likely but it is still conceivable. A more likely scenario is for gold to trade between $1070-1110. Next week looks more bearish as transiting Mars will square the natal nodes and both Mercury and Venus will come under the negative influence of natal Rahu. This looks like a larger move down, so if gold has fallen the week prior, then we could see it test the 200 DMA by early April. Gold should start to trend higher by mid-April as the Sun enters Aries. Prices should stabilize or move higher until mid to late May and then suffer another correction. It seems unlikely that the all-time high of $1200 will again be reached at this time.
5-day outlook — bearish-neutral
30-day outlook — bearish
90-day outlook — neutral