

- Stocks trending lower with some recovery by Friday
- Dollar should strengthen perhaps testing resistance at 81-82
- Gold prone to declines early
- Crude may weaken early with some rebound on Friday
- Stocks trending lower with some recovery by Friday
- Dollar should strengthen perhaps testing resistance at 81-82
- Gold prone to declines early
- Crude may weaken early with some rebound on Friday
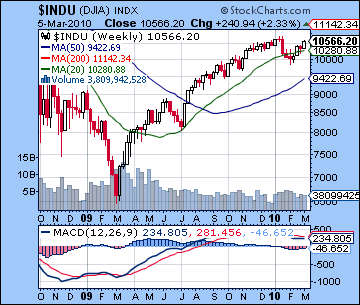
Stocks rallied more than 3% last week as positive employment numbers boosted prospects for economic recovery. The market rose on all five days as the Dow closed at 10,566 while the S&P ended the week at 1138. This bullish outcome was largely in keeping with expectations although Friday’s gains were somewhat unanticipated. Certainly, the Venus-Uranus conjunction propelled prices higher early in the week as Monday’s gain came despite some potentially difficult Mars influence. I had wondered if this aspect might have produced a down day on either Monday or Tuesday but the bears never really showed up, except perhaps late Tuesday as stocks finished off their highs for the day. Wednesday and Thursday saw some higher prices intraday as expected, although the gains were quite modest in the end. Friday was the biggest surprise as stocks had their best day of the week despite Venus losing energy as it moved away from Uranus. One possible explanation for this delayed Venus effect might be because of the clustering of planets in late Aquarius and early Pisces. The rally off the February 5 lows occurred just as Venus entered Aquarius to join benefic Jupiter and picked up more steam as the Sun and Mercury also entered Aquarius. While Venus has left Aquarius and is now in Pisces, it is still in fairly close range and the Sun and Mercury still remain in a positive conjunction with Jupiter. While I am bearish in the near term, it is nonetheless conceivable that the continued transit of the Sun and Mercury between the positions of Jupiter (optimism) and Uranus (energy) could support prices for another week or so. I don’t think this positive influence is likely to produce significantly higher prices but given my underestimation of the late week strength here, it is an outcome we should be prepared for. A more likely scenario is a test of the January highs on the major indexes followed by another decline.
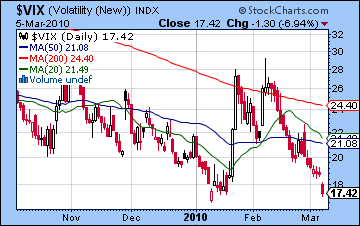
With last week’s rally, the S&P and Dow have moved to within less than 2% of their January highs. This is an important resistance level that will test the bulls this week. If the market can reach significant new highs, then that would be a huge shot in the arm for the bull camp. The short term technicals are bullish and improving as MACD is in a strong positive crossover. RSI (66) is bullish and rising and is fast approaching its overbought zone. As added evidence for the bullish case, the RSI levels match the levels it reached at the previous January highs so no bearish divergence is present. CCI (142) is similarly in bullish territory and has reached a new high for this recent rally. Volume is still a concern, however, as last week’s gains occurred on average volume only. In fact, we can see that last week’s volume was less than the volume of a similar rally up to the January highs indicating diminishing enthusiasm. Weekly indicators are still not confirming the notion that the rally has any staying power as weekly MACD on the Dow remains in a negative crossover. Of course, it is decreasing in size now but without confirming up volume or a new high, it does not offer solid evidence that the market is about to begin a new leg higher at this time. The rising prices have pushed the $VIX down further and it now stands below 18, very close to forming a potentially bullish double bottom. Readings below 20 suggest growing complacency and a lack of preparedness for any sort of unexpected bad news, whether it may involve Greece, precarious state finances like California, or other bad economic news. So Monday may well see a test of the previous highs (SPX = 1150; Dow = 10,750), although I suspect prices won’t get there before reversing down. Above 1150, the next major level of resistance is all the way to 1250-1280. We are a long way from there at the moment although I would not rule out this level at some point in the spring. Much will depend on the extent of the expected correction in the coming weeks. Some support may be found near the 50 DMA at 1110 and after that, the previous February low of 1050-1060 would likely be critical. After all, bulls could still credibly claim that even if the market fails to make new highs, the absence of lower lows means the bull outlook is still somewhat viable, albeit in more of a mixed market. Once the market falls below the previous low, that statement can no longer be made with a straight face.
 With economic prospects showing some improvement, bond yields have risen as buyers are anticipating higher interest rates and a greater risk of inflation down the road. Last week saw the 3-month T-bill climb to 0.15%, a 6-month high. This is still well within the range of the Fed’s overnight rate of 0-0.25% and so is not indicative of any imminent moves. But once it hits 0.20%, more participants may begin to wonder if Bernanke will be forced to raise rates. The market may well have discounted this eventuality for the second half of 2010. But if bond yields were to creep higher sooner rather than later (e.g. in less than 3 months) , it might force the Fed to raise rates and thus spook the markets into a sell-off. Meanwhile long bond yields also rose last week as riskier equities became more attractive than debt. The 30-year treasury is trading in a fairly narrow range here and looks poised to either move sharply higher above the key moving averages to 123 or lower back to it long term support levels of 105-108. Based on the treasuries horoscope, my best guess is that bonds will be moving higher in the near term as transiting Jupiter aspects three key points over the next several weeks. This week also looks positive. While gloomy Saturn may also be active in the this chart, the extent of the Jupiter contacts appear to outweigh the negative influence. Given the typical inverse relationship between stocks and bonds, higher bond prices (and lower yields) will often accompany lower stock prices. This near term bullish bond outlook offers additional support to the notion that stocks may stay weak for much of March and perhaps into April as well.
 This week could see stocks move lower as Venus opposes pessimistic Saturn after the close on Monday. The negative fallout from this aspect could manifest on either (or both) days although I would lean towards Monday as the day to watch. The afternoon could be particularly volatile as the Moon approaches a conjunction with Pluto near the close of trading. It is possible the market could open higher and then fall through the day although a negative gap down open seems more likely. This aspect is really a critical test case for the effect of Saturn this month. If we see a significant move down, then it greatly increases the chances that the correction will continue for at least another two weeks. If the decline is more modest, however, then it will show that the market could be choppy rather than purely negative. Tuesday could also be problematic because the Sun will come under the aspect of renunciatory Ketu. Mars turns direct on Wednesday in fairly close aspect to Saturn so that potentially bearish influence will also hang over the market. Wednesday is harder to call, however, since the Sun and Mercury will line up in alignment with Jupiter early in the day. But with the Moon opposing Mars in the afternoon, it is hard to be completely confident of a positive day. Mercury comes under the aspect of weird Ketu on Thursday which can generate sudden and violent swings in both directions. Friday could be more positive, especially if we’ve seen some declines earlier in the week. Overall, the early part of the week looks more negative with gains more likely at the end with the week being net negative. Given the presence of the Mars direct station here, there is an increased chance of a big move down here. Planetary stations can sometimes act as accelerators for price moves when other factors confirm. With Venus opposing Saturn here, there is a higher probability that any move down could be significant. But one important offsetting factor is the Sun-Mercury combination sitting in between the Jupiter and Uranus. This benefic foursome may be able to mitigate the worst of the Saturn negativity and keep losses fairly modest.
Next week (Mar 15-19) also looks bearish for the most part as any possible early week gains on the Sun-Uranus conjunction will likely go by the boards by Friday. Wednesday and Thursday, in particular, seem quite negative as Mercury opposes Saturn. Friday will see the Sun almost form its own aspect with Saturn so that is another source of potential bearishness. We should see the market make lower lows here, perhaps knocking out the February low. The following week (Mar 22-26) looks like it begin negatively also as the Sun may still be close enough to an alignment with Mars and Saturn to create a bearish atmosphere. Stability may return by the end of the week, however. After that, the market is unlikely to do very well in early April as Jupiter aspects Ketu while Mars forms square aspects with both Mercury and Venus in Aries. Gains may be more durable after the first week of April, however. So if the market puts in a bottom in April, a rally may take place that lasts until May. I am uncertain if this rally will produce new highs for the year or simply a lower high. I would lean towards a lower high. June appears to be a decisive month here and could be a reversal point. And even with the Mars-Saturn conjunction looming for late July, I believe the greater percentage losses will likely occur in the Fall 2010 and early 2011.
5-day outlook — bearish SPX 1100-1120
30-day outlook — bearish SPX 1000-1050
90-day outlook — bearish-neutral SPX 1080-1150
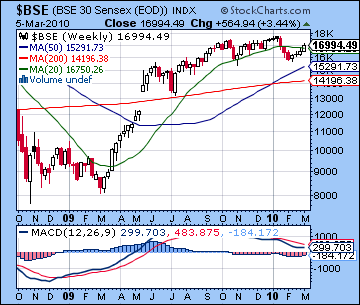
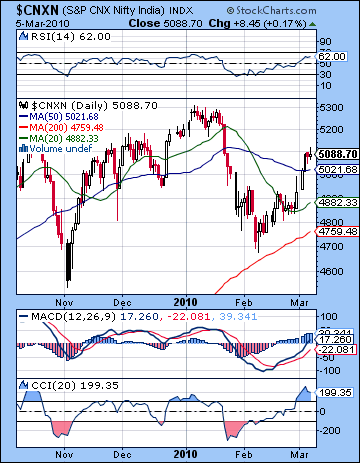 Stocks in Mumbai rallied more than 3% last week as post-budget sentiment and global cues continued to be favourable. Most of the gains were confined to Tuesday and Wednesday as the Nifty ended the week at 5088 while the Sensex finished at 16,994. This bullish result was largely in keeping with expectations as the combined effects of the Sun-Jupiter and Venus-Uranus conjunctions were enough to take the market higher in the early going. I had wondered if we might see a little more caution Tuesday on the Mars influence and indeed the first half of the day was flat. The rally came suddenly and even with some late day profit taking, the market closed higher. As expected, Wednesday was the better of the two days as Venus edged closer to Uranus. Both Thursday and Friday ended mostly flat as Venus moved past Uranus and lost its favourable disposition. While I had anticipated a little more downside, especially on Friday, this outcome fit broadly within our parameters. Overall, the Nifty managed to climb above some key resistance at 5050 and did not quite make my upside limit of 5150. As the rally extends for another week and prices move to within 4% of previous highs, bears may be questioning if the corrective phase has come to an end since the market may only be one or two good days from new highs and a possible new leg higher. On the other hand, bulls cannot be feeling too comfortable since the rally has only retraced the bottom 61% off the February 5 low. The more difficult part of the rally lies ahead as the bulls will have to push prices back to where they were in January when Saturn turned retrograde.
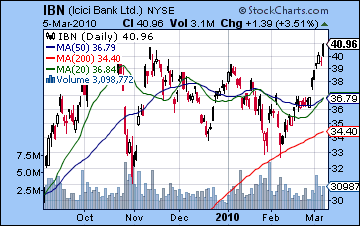
Not surprisingly, the technicals for this market have improved somewhat although one can still discern areas of weakness. The Nifty managed to rise above the 50 DMA last week so this should be seen as a bullish indication. However, the 20 and 50 DMA remain in a negative "death cross", although both have now turned higher. The market would therefore generate a minor buy signal if the 20 DMA moved above the 50 DMA. RSI (62) is quite bullish and is approaching levels last seen in January. MACD is in a bullish crossover and has once again move above the zero line, another bullish indication. CCI (199) is very bullish also, so together the three daily indicators are quite positive. And yet the weekly indicators have not budged. Weekly MACD for the Sensex is still negative for the 19th consecutive week although the gap is narrowing to reflect this recent bounce. And as noted last week, the run-up here may have sown the seeds of a bearish head and shoulders pattern. While current prices are high enough to make it effective now, it can still be in place for the next 100 points on the Nifty all the way up to 5150-5200 which would match the December highs. In that sense, the next 2% on the upside may not significantly change the technical picture since the Nifty would still be prone to sell-offs once the right shoulder was in place. For the bulls, the only target that matters now is the previous high of 5300. If it’s taken out, then the market could draw in new money. The financials are also a critical juncture as seen in the ICICI chart (IBN). While very strong last week as a result of improved economic prospects for India, Friday’s high has equaled October’s high. Until prices break significantly above $41-42 (on the NYSE), the stock should be viewed skeptically. I still think the bearish scenario makes the most sense in the short term so I’m doubtful the market can move that much higher this week. If it’s going to go back down, support levels become more important. Nifty 4900 may bring in new buyers as bulls will try to stanch any sell-off. The real ‘line in the sand’, however, is probably around 4700 and the February low. If the market trades below that level, then it will form a lower low and thus shake the confidence of some bullish investors. This would likely generate more selling and take prices perhaps back to 4500.
 This week seems more bearish as the Venus-Saturn opposition may loom large early in the week. Monday could conceivably escape without too much damage and indeed the Mercury-Jupiter conjunction could produce a significant gain. Tuesday will see Venus move into very close opposition to Saturn so that may be the most likely day for a decline. Wednesday also could be difficult since Mars returns to direct motion while in minor aspect with Mercury, the planet of trading. Between Monday and Wednesday, we should be net negative, with probably two down days. The end of the week looks somewhat stronger and should see some rebound. Thursday’s open could be bearish as the Moon opposes Mars but some recovery seems likely by the close. Friday could be the best day of the week as Mercury is aspected by Ketu. This combination could produce sudden moves and if we have seen some significant declines earlier in the week, Friday could well be positive. Overall, I think the Nifty may top out around 5150 and then head lower, perhaps below 5000. With some late week recovery likely, the Nifty may close somewhere between 4900 and 5100. While bearishness is the most likely outcome here, we should also note that the Mars direct station increases the planetary ‘torque’ somewhat and opens the door to a possible big move down. This is not to say that a 5% single day decline is likely, but the Mars influence here increases the likelihood of such sizable loss at this time.
 Next week (Mar 15-19) also seems fairly difficult although it may begin positively on the Sun-Mercury-Uranus conjunction early in the week. Market conditions will likely deteriorate as the week progresses as Mercury will oppose Saturn by Friday. The following week begins badly on the Sun-Saturn opposition and may recover somewhat afterwards. Thursday the 25th stands out as particularly positive as Mercury is in aspect with Jupiter. Late March and early April look mixed to positive with bullish aspects such as Venus-Neptune predominating. April may see a gradual strengthening of prices although any rally we may see is unlikely to be strong. And late April looks fairly bearish so there could be a consolidation phase of higher lows before a longer rally takes place. May should be generally positive as Jupiter approaches Uranus but June may see some weakening as Saturn stations in tense aspect with both Uranus and Neptune. The Mars-Saturn conjunction in late July is also likely to correspond with a period of significant declines although the larger declines in percentage terms may occur in September and October.
5-day outlook — bearish NIFTY 4900-5100
30-day outlook — bearish NIFTY 4500-4700
90-day outlook — bearish-neutral NIFTY 4700-5200
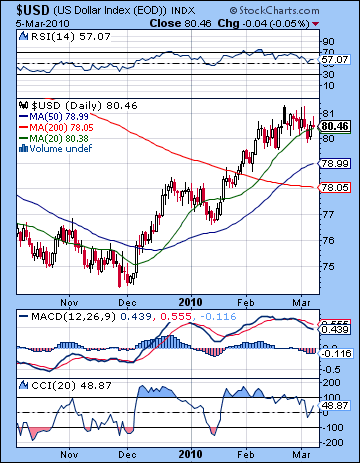 The US Dollar Index held firm near 80.5 last week amidst news of improved economic prospects and a more likely bailout of the Euro. I had been more bearish here expecting the early week losses to be take the index down to 79. As it happened, the Dollar only break through 80 as the weakness was less severe than forecast. Monday ended up positive despite the Mercury-Saturn contact, a sign perhaps of a greater than expected reservoir of strength. The late week bounce came off more or less on cue as Thursday’s gain vaulted it back above 80. Overall, the Dollar performed fairly well here as it ended the week close to its 20 DMA. The inability of the Dollar to correct back even to its rising trendline from the December lows to 79.5 is an indication of how bullish it has been. Nonetheless, technicals have worsened as daily MACD has formed a deeper bearish crossover. RSI (57) is still in bullish territory although it is generally weakening now. CCI (48) looks like it is eroding here although it only moved briefly below the zero line before recovering at the end of the week. While the dailies appear to be vulnerable to more declines, the weekly indicators still look strong as MACD remains in a bullish crossover. Volume on the Dollar ETF UUP is strong but remains well below the volumes that marked the large rises in previous weeks. Support around 79.5 may be tested early this week, and below that the 200 DMA at 78 would be the next key level. Resistance is still around 81-81.5 as the early week period saw trades in that range only to fall back later on. If this level is broken, it could lead to a substantial break out to the upside that may go all the way to 83.
This week generally looks favorable for the Dollar as Monday’s Mercury-Jupiter conjunction lines up right on the natal Moon in the USDX chart. This sets up the possibility for a sizable gain on either Monday or Tuesday. The Mars station on Wednesday will be in close aspect to the natal Saturn so there is a possibility for some negative days this week but generally the influence of Jupiter to the Moon should carry the day and take the Dollar higher. If we see some down days, they are more likely towards the end of the week. The rally should continue through to April as Jupiter will be moving through a particularly sensitive part of the 4th house over the coming two to three weeks. After that, the gains may be less forthcoming but there should be some strength to the Dollar until perhaps mid-April. Pullbacks are likely to be fairly shallow and brief, however, until late April and early May when we may see a more significant correction. If May and June are less kind to the Dollar, we should see more gains after as the summer looks generally favourable.
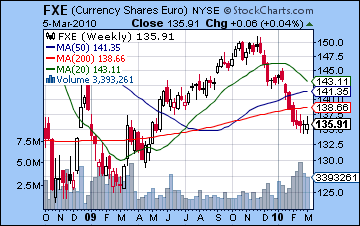 The Euro rallied off its lows below 1.35 this week as the prospects improved for a bailout of Greece. I had expected more upside here towards 1.38 but the general weakness in the Euro held it down to 1.37 at its highest before closing a little over 1.36. The gains came somewhat later than expected as Monday’s Venus conjunction to the natal Jupiter — ordinarily a very bullish measurement — actually saw a modest decline. Bullishness resumed on Tuesday and Wednesday, however, with Venus still within range. The Euro is still in a technically challenged position as it trades well below all its major moving averages. However, daily MACD is now in a widening bullish crossover so it’s conceivable that we could see more upside in the near term. This week may be a moment of truth of sorts for the Euro as the Venus-Saturn opposition sets up right atop its ascendant-descendant. This is a very powerful placement that speaks to a significant move, most likely lower. There is still a chance that this pattern could result is a gain in the early week period because of the presence of Mars in the three-way planetary alignment. However, I am interpreting Mars’ influence near the 11th house cusp as negative and hence it should pave the way for the Euro to retest recent lows of 1.35. Friday stands out as a day of probable gains as the Sun will conjoin the natal Jupiter so that may elevate the Euro back towards the 1.35 level. The Rupee rallied to new highs on post-budget optimism as it closed near 45.5. I expect a significant weakening this week and next with the Rupee sliding to 47.
Dollar
5-day outlook — bullish
30-day outlook — bullish
90-day outlook — bullish
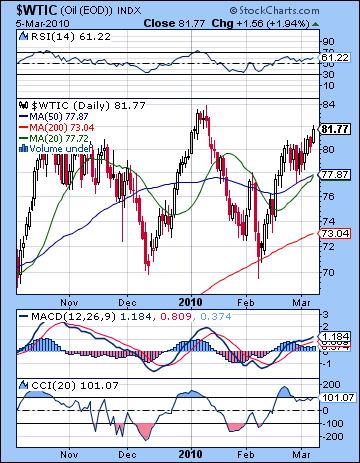 As expected, crude oil rallied last week on recovery hopes as the continuous contract closed just under $82. I had anticipated the gains to begin Monday but as it turned out, the fruits of the Venus-Uranus conjunction did not accrue until Tuesday and then continued into Wednesday. The late week period was expected to be somewhat more mixed and indeed Thursday was lower. However, I missed Friday’s big up day as Jupiter occupied the midpoint between Sun and Mercury. I had suggested that crude could well reach above $81 last week and that in fact came to pass, although it failed to equal recent highs of $83. That is a crucial difference because now the price exists in a danger zone where the chart forms a head and shoulders pattern with current prices on the right shoulder roughly equaling the left shoulder highs of November. If the rally does not continue to $83, then it may scare the bulls off and profit taking will ensue, perhaps on a large scale. That said, the picture is not all bad for crude. Daily MACD is still positive, however, and CCI (101) is also well positioned in the bullish zone. RSI (61) is also bullish although it shows signs of topping. Weekly MACD is quite flat and remains slightly negative, a possible indication that the rally is not sustainable. $83 is clearly a major resistance level, and if prices rise above that, it will open the door to $90. That said, I don’t expect a move to that level at this time. Support is likely found around the 20 and 50 DMA, now intersecting at $77-78. Below that, $70-72 offers more formidable support since it matches the December and February lows. While this level should hold this week, a significant retreat would confirm the head and shoulders pattern and could spark a larger sell-off through March and into April.
This week’s Venus-Saturn opposition looks quite negative for crude so we should see weakness predominate the early week period. It is difficult to say if the bears will rule Monday or Tuesday and indeed declines are possible on both days. More likely prices will be net negative over both days with Monday looking somewhat worse. Wednesday may see some relief but Thursday could go either way as Mercury’s aspect with Ketu could correspond with unpredictable or unforeseen events. Friday seems more positive as the Sun approaches the apex of the Futures chart in the 10th house. Next week looks quite bullish in the early going but watch for weakness to resume by late in the week. If the pullback comes off as expected this week, then the early week gains may only take the form of a technical rally which fail to gain back all the losses. So we could see prices fall to $70-72 this week and have a rally attempt early next week to $75-78 and then sell off again by the 19th. Prices look mixed at best through March, with a bearish bias. Crude should rally after April 5 and strength should continue through May and into June as Jupiter will conjoin Uranus in the 10th house. This is a very strong position for benefic planets such as Jupiter and it may be enough to negate any weakness generated by transiting Saturn’s aspect to the natal Rahu.
5-day outlook — bearish
30-day outlook — bearish
90-day outlook — bearish-neutral
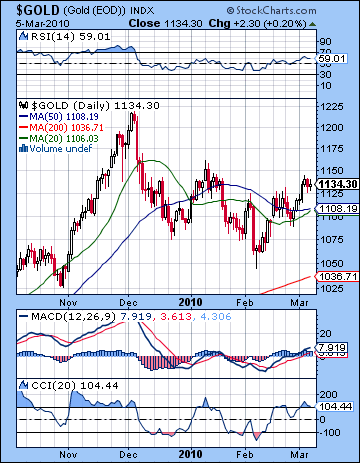 Gold rallied 2% last week to $1134 as risk appetite returned to the market as improved economic data fueled inflationary scenarios. This bullish outcome was largely in keeping with last week’s forecast as the Venus-Uranus conjunction delivered most of the gains early in the week. However, I was mistaken in calling for a decline Tuesday since it proved to be the best day of the week for gold. Most of the gains occurred over Tuesday and Wednesday and that fit broadly with my call for Wednesday’s bullishness. As predicted, the late week period was more mixed as Thursday saw a modest pullback that was not sufficiently offset by Friday’s even smaller increase. Despite the gain last week, gold failed to reach previous highs at $1150-1160 as Wednesday’s rally topped out at $1145. Prices are still above the 20 and 50 DMA ($1110) and those short term moving averages are poised for make a bullish crossover if prices should continue to rally. Daily MACD is already in a bullish crossover and is now above the zero line. It is also in the early stages of a bullish divergence with respect to its previous high. RSI (59) is similarly bullish and shows evidence of moving higher still. CCI (104) is bullish although recent forays into the bullish zone were lower than in previous rallies. However, weekly MACD is still in a bearish crossover suggesting that the inability to break above previous highs may fatally wound this rally. If the bulls cannot take prices above $1150, then watch for the bears to move in with a vengeance. I think this is the most likely scenario in the near term with the 50 DMA serving as a temporary level of support at $1100-1110. Below that, the previous low of $1060 (close) looms large since any trades below that jeopardizes the bullish case for gold. After a possible failed rally to a higher high, if gold were to make a new lower low here it would seriously weaken sentiment as more participants would seek to exit their long positions.
This week gold may decline early in the week on the Venus-Saturn opposition. Since Venus is a co-ruler of gold, Saturn’s influence is unlikely to boost prices, particularly when transiting Venus is at the bottom of the GLD natal chart. Monday could mark the beginning of the bearishness as the Moon conjoins the ascendant in the natal chart although Tuesday also has the potential to take prices lower. Wednesday seems somewhat more positive, although the Mars direct station at noon could be a wild card. Thursday and especially Friday look more positive as Mercury approaches the Sun and both make their way towards Uranus. While a negative day is likely from Wednesday to Friday, it should be net positive. Overall, however, the losses may outweigh the gains although perhaps not by much. A lot will depend on what kind of pullback we see early in the week. Gold seems unlikely to trend higher until perhaps April so an extension of the correction is a more likely scenario. Some strengthening is likely through May but June looks difficult again for gold. The summer as a whole looks mixed but watch for a more significant rally to begin in September. It is possible that the June to August period might be a good time to accumulate long positions in anticipation of the probable Fall rally.
5-day outlook — bearish
30-day outlook — bearish
90-day outlook — bearish-neutral