

- Stocks trending higher after declines Monday or Tuesday
- Dollar to weaken by Friday
- Gold to rebound after early weakness
- Crude to stay strong with gains more likely after Tuesday
- Stocks trending higher after declines Monday or Tuesday
- Dollar to weaken by Friday
- Gold to rebound after early weakness
- Crude to stay strong with gains more likely after Tuesday
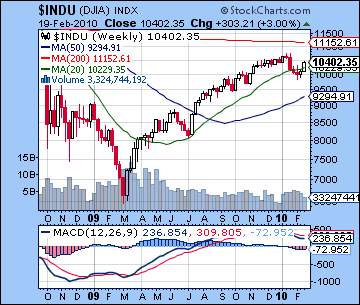
Worries over potential Fed tightening were offset by positive economic data last week, as stocks extended their rally off of recent lows. The Dow was up 3% to close at 10,402 while the S&P finished at 1109. I had expected more downside here on the Mars-Saturn pattern, although the early and late week strength came off largely as forecast. Tuesday’s Venus-Jupiter conjunction delivered a gain more or less on schedule as the market enjoyed its most positive day of the week. More puzzling was Wednesday’s modest gain which I had expected might produce more lingering uncertainty over the Eurozone. It seems the bulk of the tension contained in the Mars-Saturn aspect manifested last week and into Monday on global markets — a holiday in the US. As expected, Thursday and Friday were both positive as the Sun joined Venus and Jupiter in Aquarius. Overall, the market showed a significant amount of bullishness as it pushed back to a significant resistance level (1110). While I had certainly expected these levels by early March, their early arrival last week was food for thought. Is this strength of last week’s gain a sign that the correction is over? Or can we safely assume that this short rally falls within the normal parameters of a larger consolidation phase that will see prices fall further in the weeks ahead? While the gains were impressive, they did not significantly alter my assessment of the market. The most likely scenario is that we are still in a correction, albeit one marked by major rallies.
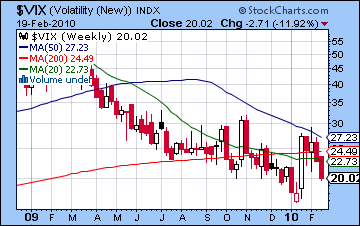
One reason for being skeptical of this rise is that up day volume continues to lag behind down day volume, a sign that price rises are not enjoying widespread participation. And while the gains were substantial, the market is at a crossroads here since Friday’s close of 1109 on the S&P matched a key resistance level — the 50 DMA and the previous high of early February. So those are two technical reasons that might undermine the ability of prices to move significantly higher this week. That said, bulls can point to a strong MACD crossover in the daily S&P chart, although this is still very much in negative territory. RSI (55) is now also in bullish territory, and this level matches a series of RSI peaks formed in November and December. CCI (113) has similarly bullish now, although it is unclear just how long the good times might last. The CCI made a similar spike above 100 in November and the result was a sideways market for next month. Another bullish signal might be that the $VIX (20.02) has broken below its 50 DMA so it may be revisiting its recent lows of 17 in the near future. Broader averages like the NYSE Composite ($NYA) look slightly weaker than the leading indexes, however, as Friday’s close very matched the previous highs and did not reach the 50 DMA. As another possible bearish sign, the $NYA currently sits close to its 50% retracement between the January 19 high and the February 5 low. We should also note that the weekly MACD for the Dow remains mired in a bearish crossover. While this likely does not impact whether or not the market can rally back to its January highs, it does offer a more medium term bearish outlook. While the S&P currently stands at a key resistance level, we could conceivably stretch this level to 1120 which would include some of the intraday highs dating back to November and more importantly approximate the support from the rising trendline dating back to August and September. This support trendline now may be acting as resistance so we should not treat 1120 as significantly breaking above resistance levels. After that, the previous highs of 1150 are an obvious resistance level. If we see gains this week, then the market will likely test those January highs in early March. Support remains at SPX 1040 which was successfully tested last week. This likely won’t be tested until the second week of March at the earliest. After that, SPX 1000 may bring more buyers back into the market perhaps in late March or early April.
 Fed Chair Bernanke’s decision to raise the discount rate 25 basis points caught many observers off guard last week. While it initially spooked foreign markets, US markets did not interpret it as part of a larger trend towards tightening. The bond market also did not take much immediate notice of it as the 3-month yield on treasuries remained at a manageable 0.10%. The 30 year bond is again pushing towards the magical 5% level as it closed higher this week at around 4.75%. With Greece and the problems of Club Med now temporarily pushed to the sidelines, the actions of China’s central bank may take center stage this week as it may be forced to tighten further. If there is a sudden negative market reaction in Shanghai, it could very well spread through global markets. While some relatively insignificant moves are possible next week, the chart of the Fed seems more activated around March 8-9. This is a more likely time when its actions are in the spotlight and when it is forced to adapt to changing circumstances in the financial markets.
This week looks quite mixed with declines possible midweek and gains more probable on Friday and the Sun-Jupiter conjunction. While Monday has the Moon exalted in Taurus, Mercury forms a minor aspect with Saturn so that could introduce a distinctly negative tone to the markets, especially in the morning. Tuesday looks stronger, however, as the Moon enters Gemini and comes under the aspects of both Jupiter and Saturn. Mercury will form a minor aspect with Rahu so that could increase volatility, although the prospects for a positive outcome seem reasonable. Wednesday and especially Thursday seem more prone to declines. On Wednesday, the Moon approaches Rahu and then suffers an even greater affliction on Thursday by virtue of sitting in the middle of Rahu and Mars. Friday looks more solidly bullish as the Sun moves to within one degree of Jupiter while Mercury comes to within one degree of Neptune, both positive influences. So the best days of the week are likely Friday and Wednesday, while the most bearish days of the week are Monday and Thursday. Depending on what kind of sell-off we see on Monday, we could finish the week around current levels or maybe a little above. If Monday’s decline is significant and it falls under SPX 1100, then that increases the likelihood that current resistance levels will hold by Friday and we end up around 1105-1115. Friday’s gain could well be sizable, however, especially if we have seen some significant down moves beforehand.
 Next week (Mar 1-5) may well mark the last week prices are above the 1100 level. Monday may be difficult as a minor Mercury-Mars aspect could generate more selling. Tuesday sees a Mercury-Saturn aspect that also has some bearish potential, although strong gains are likely by Wednesday’s Venus-Uranus conjunction. Thursday also looks quite positive on the Venus-Neptune aspect although Friday looks weaker. Overall, the picture looks quite mixed although a bullish bias is still possible as some of these planetary combinations could produce sizable gains. The following week (Mar 8-12) looks more negative on the Venus-Saturn opposition on Tuesday. Mars turns direct on Wednesday opposite the Moon so that is also probably going to be a negative influence. After that, the Sun and Mercury will both oppose Saturn by March 21 so that may well usher in a period of significant bearishness. In a more bearish scenario, this period of falling prices would continue until the first week of April and the Jupiter-Ketu aspect. This is less certain, however, since Ketu’s influence isn’t always negative. Sentiment is more likely to improve through April as Jupiter approaches Uranus.
5-day outlook — neutral SPX 1090-1120
30-day outlook — bearish SPX 1040-1080
90-day outlook — bearish-neutral SPX 1040-1110
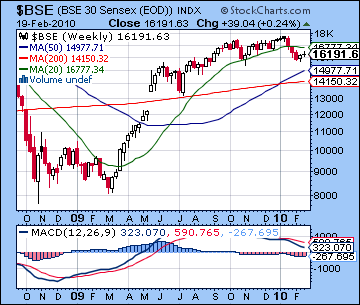
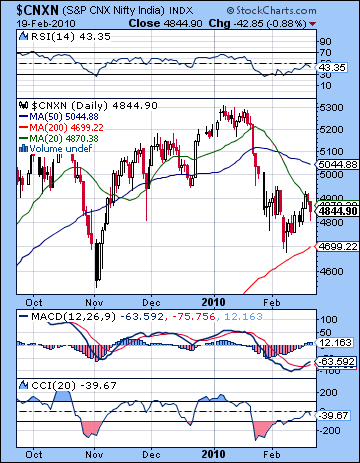 Stocks eked out another gain last week despite some late week jitters resulting from the US Fed’s increase in the discount rate. After rising towards 16,500 midweek, the Sensex closed at 16,191 while the Nifty ended Friday at 4844. This mixed outcome was more or less in keeping with expectations, although I had thought the end of the week would be more positive. The close Mars-Saturn aspect did not affect sentiment unduly as Monday saw only a tiny decline and kept prices down for the first half of Tuesday. The bullish influence of the Venus-Jupiter conjunction arrived on schedule as prices rose sharply into the close on Tuesday. Wednesday’s gain was more modest on the exact conjunction after which the market retreated for Thursday and Friday. One possible explanation of the late week pullback was that the Moon entered Aries and the debilitated condition of its lord, Mars, was less conducive to gains. While the overall up week may have been heartening to bulls, the market appears to remain in a corrective phase well below its January highs. This is perhaps more telling of growing market weakness since we are in currently in a pre-budget period when prices typically run higher. Even if we see some gains before or after this Friday’s budget, they are unlikely to take prices too much higher. Indeed, the month of March features several difficult Saturn transits that have the potential to initiate another leg down. As both the US Fed and China’s central bank move to squeeze excess liquidity out of the system, investors may soon feel the pinch.
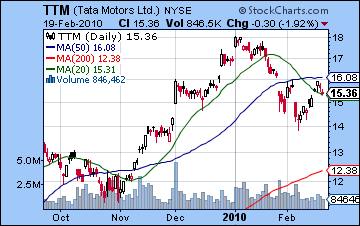
The technical situation still appears to offer more support to bears. Friday’s close of 4844 on the Nifty was close to the 20 DMA, now a possible resistance level. With the 20 and 50 DMA still forming a deep death cross, bulls may be reluctant to take prices above the 20 DMA. As a result of the bounce of the past two weeks, daily MACD is now in a bullish crossover although it is deeply in negative territory. CCI (-39) has moved out of the bearish zone but it has yet to enter the positive territory, let alone the bullish zone (+100). This suggests that recent gains may be little more than a technical bounce. RSI (43) is also still bearish, even if it has popped up somewhat since the previous lows. The weekly BSE chart also looks generally bearish as the MACD crossover remained in place for the 16th consecutive week. While this indicator does not rule out for gains in the short term, it does not point to any fundamental strength in the medium term. Tata Motors (TTM) has been a leading stock in the recent rally but it, too, has failed to move higher in 2010. While it has consistently outperformed the Sensex over the past three quarters, it now also features a bearish crossover in its weekly MACD chart. With the prospect of some more upside likely, resistance levels should be watched carefully. The 50 DMA around 5000-5100 may figure prominently in the days ahead as bulls could attempt to take prices back to that level by early March. Since this roughly coincides with the bottom of the rising wedge, this resistance should be formidable. Support may be found near the 200 DMA, now approaching 4700. This is a fair distance away from the November lows of 4550-4600, although they may be best thought of as a single support level. If the November lows are broken in March, then 4000 would be the next support level.
 This week looks mixed with a bullish bias as investors await Friday’s budget announcement. Monday may tend towards selling as Mercury forms a minor aspect with pessimistic Saturn. Tuesday may be more positive as the Moon is exalted in Taurus while in aspect to Mercury. Gains are more likely from Wednesday to Friday as the Sun-Jupiter conjunction moves closer. That said, we are still likely to see one significant down day there, perhaps on the Moon-Rahu conjunction on Thursday. Wednesday may also begin weaker as the Gemini Moon is in aspect to Saturn, but strength may return by afternoon. Friday will see the Sun less than two degrees from Jupiter so that should orient markets towards gains. The Moon conjoins Mars just before the open of trading and that likely indicates heavy volume. We should also note that the transiting Jupiter (15 Aquarius) will form a positive aspect with the Sun (16 Libra) and Venus (16 Libra) in the NSE natal chart over this week and next so that increases the likelihood of gains both before and after the budget. While Monday could be quite negative and take the Nifty down below 4800, Friday looks like it has the potential to offset any bearishness we see earlier. And if the early week period does not see a significant pullback, then it’s conceivable we could see 5000 by Friday on the Nifty. I don’t think this is the most likely scenario but it is definitely a possibility. 5000 may have to wait until next week as Venus conjoins Uranus. The budget itself should be favourably received since it will be delivered so close to a Sun-Jupiter conjunction. It may also continue stimulus spending and increase social spending also since Jupiter (generosity) will be influencing the Sun (government). Mercury will also be close to an alignment with Neptune and Uranus so we could see transport and communications highlighted in some way, perhaps with significant new initiatives and spending.
 Next week (Mar 1-5) looks quite strong in the early going as the Sun will still be in range of Jupiter. A close at or above resistance levels of 5100 is very possible here. Tuesday may be less positive, however, as Mercury is in aspect with Saturn so if Monday is up, Tuesday will likely see profit taking. Wednesday looks bullish again as Venus conjoins Uranus. The end of the week looks more mixed, although a bullish bias is still possible. I would not rule out another run up to the January highs in this first week of March. The following week (Mar 8 -12) is likely to see the market reverse down, perhaps sharply. Venus is in aspect with both malefics, Mars and Saturn, while Mars itself could become a focal point as it turns direct on the 10th. There is a possibility of major down days here (>2%) although the late week period may see some recovery. After that, March seems largely bearish with the bulls unlikely to gain much traction until perhaps April. the Jupiter-Ketu aspect in late March and early April may be pivotal since it could mark a bottom. April generally looks more promising than March, so if the correction deepens as expected in March, then April would see another significant rally attempt which could extend into May.
5-day outlook — neutral-bullish NIFTY 4800-5000
30-day outlook — neutral NIFTY 4700-4900
90-day outlook — bearish-neutral NIFTY 4500-5000
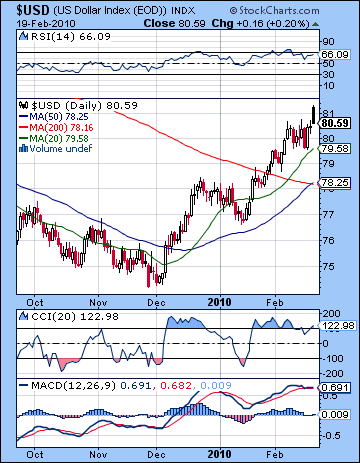 The US Dollar continued its winning ways last week on improved economic prospects and the Fed’s discount rate hike. After trading well above 81 in the early going Friday, the greenback finally settled near 80.5. This mildly bullish outcome was not significantly out of step with last week’s forecast although I had expected more declines later in the week. Wednesday was the most bullish day of the week and that correlated with the Moon-Mercury-Jupiter pattern I outlined in last week’s newsletter. Friday’s large trading range underlined the importance of the 81 resistance level as early enthusiasm for the Dollar could not be sustained through the day. The technical picture shows more signs of future weakness here as daily MACD is on the verge of a bearish crossover. RSI (66) is still very bullish but reveals a series of declining peaks. CCI (122) is also nominally bullish but we may note downside probing below 100 and consecutively lower peaks. The weekly chart shows an indecisive doji candlestick and while MACD is still bullish, we should not rule out a correction in the near term. While we could see more rally attempts above 81 this week, understanding support levels may be more important at this point. The 20 DMA at 79.5 is the most immediate support level that will be tested here. It was tested last week successfully, and another test seems imminent. Below that, the 50 DMA and 200 DMA have met around the 78 level, so that should also be seen as a possible interim low as we move into March.
This week looks positive for Monday as transiting Venus will be within striking distance of the natal Moon in the USDX chart. A close above 81 is not out of the question here. Tuesday could also generate more gains as Venus is in aspect to Mercury in the natal chart, but this seems somewhat less bullish than Monday. The situation looks less positive as the week progresses, however, so that we could see any early gains erased by Friday. Overall, we could finish close to current levels, although with some kind of correction in the offing, I would have a negative bias here. The first week of March seems more bearish again as Mercury will form an aspect to the natal Saturn. I would not rule out a decline down below 79 at this time. It’s possible the Dollar will rally again before the end of this week although Monday the 8th looks quite positive on the Mercury-Jupiter conjunction. March looks very positive so we should see the resistance level of 81 fall quickly then. 83-85 is possible by the end of March.
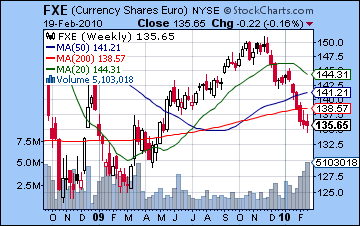 With the crisis over Greece no closer to resolution, the Euro lost a little more ground last week closing below 1.36. As expected, 1.35 was tested last week on Friday but the Euro did manage to recover by the close. The technical picture remains bleak, however, as the weekly chart shows a significant MACD crossover. Volume has peaked in the ETF, although with the losses fairly modest in the past two weeks, that is somewhat less bearish. Indeed, it may well signal that a turnaround is at hand. The daily MACD chart did feature a small bullish crossover so the rebound rally scenario seems more plausible now. If a rally is in the offing here, we could see the Euro climb as high as 1.40-1.41 which is the 50 DMA. This week may see another test of 1.35 in the early going, but some strengthening is likely by Friday as the Sun-Jupiter conjunction will occur in aspect to the natal Sun in the Euro chart. The rally should continue into early March but may be stopped in its tracks by the Venus-Saturn opposition on March 8. 1.35 will again be tested in March, and we could even see 1.30 at some point. The Rupee strengthened last week closing at 46.2. Some further gains are likely around the budget so a close below 46 is very much in the cards.
Dollar
5-day outlook — bearish-neutral
30-day outlook — neutral
90-day outlook — bullish
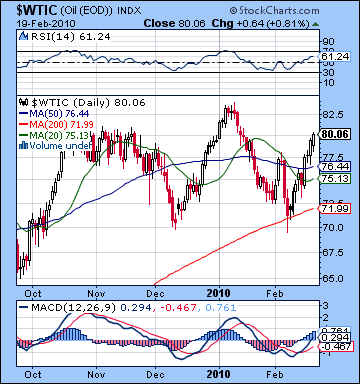 Crude surged higher on demand expectations before closing near $80 on the continuous contract. I had anticipated more of an early week pullback but Monday’s decline turned out to be fairly modest. The gains forecast for later in the week came to pass and exceeded expectations. While I forecast $80, I did not expect that level to be reached until early March. So the rally in crude is well underway here as daily MACD is in a bullish crossover and has now moved above the zero line. CCI (187) is very bullish and points to more gains ahead. RSI (61) is also bullish and looks poised to go again to the 70 level. Tuesday’s huge gain came on the Venus-Jupiter conjunction and cut through the 76 resistance level and the 50 DMA without any difficulty. The previous highs of 83 should be the next resistance level and we could well see that tested this week. After that, $90-92 would represent the upper trendline and should be seen as the most bullish scenario for crude. If we see $90 here, it will likely be in the first week of March.
This week may see some profit taking early on as the transiting Sun (9 Aquarius) may activate the Moon-Saturn conjunction (9 Libra). This might be a sizable pullback to $76-77 but with the Sun approaching Jupiter late this week, all negative configurations may be fairly muted. As we move towards Friday, gains are again more likely and we could well finish higher although we may not break above the previous high of $83. Next week looks mostly bullish so it is possible we could see a push towards $90. The enthusiasm for crude should fade by the second week of March as Venus opposes Saturn.
5-day outlook — neutral-bullish
30-day outlook — neutral
90-day outlook — bearish-neutral
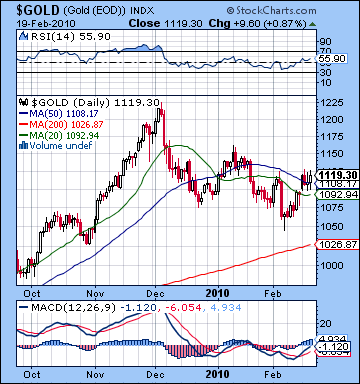 Gold extended its rebound rally last week closing at $1119 on the futures contract, up 2%. This result was somewhat more bullish than expected, mostly since we did not see a significant down day in the early week. Monday saw some intraday bearishness on the Sun-Neptune conjunction but prices largely recovered by the close. Tuesday’s Venus-Jupiter conjunction produced a big gain as forecast. Wednesday was negative with small gains posted on Thursday and Friday. I had expected the resistance provided by the 50 DMA at $1113 to hold but it was only partially up to the task as prices drifted above this level on Friday. Gold tested the support of the medium term rising trendline last week at $1050 and has moved higher for the second week in a row. Resistance is likely around the previous high of $1150-1160 which also happens to coincide with the bottom of the long term rising trendline dating back to October 2008. If gold should break above $1160, then it may go all the way back to previous highs of $1220. I don’t think this is likely but it is something to keep in mind if it approaches $1160. Technical indicators point to more upside here as we have a bullish crossover in the daily MACD, although it is still below zero. CCI (112) is now bullish and RSI (55) looks somewhat healthier although we should caution that it has merely matched previous peaks formed in January. While the short term indicators look encouraging, the weekly chart is not necessarily evidence for the bulls since weekly MACD is still in a negative crossover. Overall, the technical indicators offer some support for further gains, even if they are limited.
This week’s Sun-Jupiter conjunction should help prices to stay strong. Some early weakness is likely, however, as the Sun forms a minor aspect with Saturn on Monday. This is likely to manifest in a decline either Monday or Tuesday and could take prices back below $1100. More bullishness is likely towards the end of the week so I would not rule out highs above $1120. The following week also looks positive so a test of $1150-1160 is likely. Gold will likely trend lower after that as the Venus-Saturn opposition on March 8-9 will probably take prices lower, perhaps substantially. March looks mixed at best, with the possibility of lower lows especially towards the end of the month and the beginning of April.
5-day outlook — neutral-bullish
30-day outlook — neutral
90-day outlook — bearish-neutral