

- Stocks mixed with probable declines later in the week
- Dollar could become choppy as it encounters resistance
- Gold remaining bearish but one or two days of gains likely
- Crude prone to declines late in the week
- Stocks mixed with probable declines later in the week
- Dollar could become choppy as it encounters resistance
- Gold remaining bearish but one or two days of gains likely
- Crude prone to declines late in the week
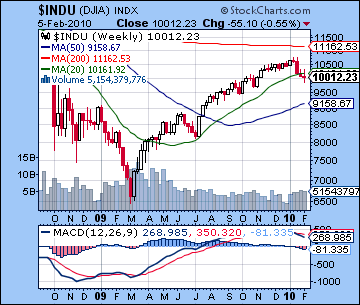
Stocks extended their losing streak last week as investors grappled with growing fears of European sovereign debt default. After trading well below 10,000 on Friday morning, the Dow closed down less than 1% for the week at 10,012 while the S&P finished at 1066. As breathtaking as the late week decline was, stocks were actually little changed on the week. My forecast was out of sync with the intraweek trends, as I thought we would see selling precede some rebound buying later on. In fact the opposite occurred, although the late Friday rebound was not entirely unexpected. The early week saw prices move back up above 1100 as the minor Mercury and Venus aspects with Saturn did not produce the predicted effect. One possible explanation was that the approach of Jupiter to Saturn was more than enough to counteract any minor aspects. Certainly, I did expect Jupiter to play its bullish part last week although I expected gain to manifest when the aspect was closer to exact on Thursday and perhaps Friday. In fact, the day the Jupiter-Saturn aspect became exact was the same day the market plunged 3%, implying that the positive influence from Jupiter was felt in the three preceding days. In last week’s newsletter, I was not certain how this Jupiter-Saturn aspect would play out and had allowed for the possibility that Jupiter could actually act as an accelerator for deeper declines. In retrospect, that was certainly the case as the market stayed in correction mode for its third straight week. Although my weekly forecast left something to be desired, it was not too far wrong in terms of the trading range as the S&P traded fairly close to the 1040 support level on Friday — 1044 to be exact — after trading as high as 1105 on Tuesday. Overall, sentiment continues to sour in the aftermath of the January 15th solar eclipse and last week’s action offers more evidence that we may have seen a meaningful top in the market, if not for the year, then at least for the quarter.
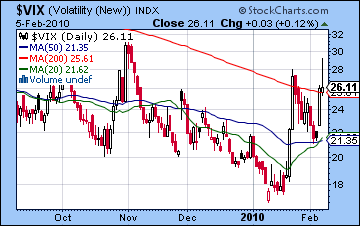
We can see more technical reasons for believing the correction is not yet done. Volume for up days continues to be less than volume on down days, suggesting that bulls may be exiting the market for fear of lower prices down the line. The rally’s momentum has eroded to the point where both the 20 and 50 DMA are now falling for the first time since July 2009. In fact, we can now see a very bearish "death cross" of the 20 and 50 DMA in the SPX daily chart, although this pattern is more pronounced in the Dow and NYSE Composite charts. One has to be cautious about attributing too much weight to a single chart factor, but when combined with other signs of growing technical weakness, it does not help the bullish view of the market. Daily MACD is still in a negative crossover and RSI at 36 is also in bearish territory, although it may nonetheless be in the process of forming a bullish divergence given its double bottom. CCI at -134 is still bearish even if it briefly broke up above the -100 line for the rally early last week. The weekly charts also suggest a bearish outlook as the Dow MACD had its largest bearish crossover so far in this correction. Not surprisingly, volatility has spiked as a result of last week’s gyrations as the $VIX moved to its highest levels since early November. What may be worth a special mention, however, is that the $VIX did not go below its 50 DMA at any time during the week. This is perhaps significant of a new level of uncertainty with the market and may foretell of continuing volatility in the weeks to come. The late week sell-off was a successful test of the 1040 level on the S&P, or 9700 on the Dow. This represented the November low and the market’s ability to stay above that support level gave bulls some encouragement to go long once again. In that respect, last week’s trading did little to change the critical support levels since the previous lows of 1080 had already been breached. For this reason, 1040 remains a keys support level and below that 1000 on the S&P which would be equivalent to about Dow 9000-9100. While it’s possible we may test 1040 again this week, the possibility of a deeper decline to SPX 1000 may have to wait until early March and the culmination of the Mars retrograde cycle. Of course, just how low we go this week will depend on any early week bounce so let’s wait and see. In terms of resistance, prices above SPX 1100 would likely bring out more sellers, especially since this would be close to the 50 DMA around 1110. One potential scenario would therefore see the market try to rally back to this immediately preceding resistance level of 1100 and then kiss it goodbye before resuming its decline. Since I am expecting another rally attempt this week, we could see something like that unfold, although I have my doubts if the market can move that much higher.
 Part of Friday’s afternoon rally was the result of rumors of some kind European bailout of Greece. If such a bailout were to happen, it would considerably reduce the anxiety in financial circles about the possibility of a debt default. Both Greece and Portugal have promised the EU that it will clean up its balance sheet sufficiently to achieve the target of debt to GDP of 3% by 2012 or 2013. If Greece were to default, it would spark greater fears a contagion effect and a repeat of what we saw in 2008 and the freezing up of global credit markets. The recent run on the Euro and soaring US Dollar reflects the current mood quite well. As the Dollar steps in to fill the void, the carry trade grows ever more precarious. A good portion of the run-up in stocks was stoked by the carry trade in cheap US Dollars but now that it is appreciating, this easy strategy is no longer viable. While some money has already been unwound, it’s unclear just how vulnerable stocks are from any further Dollar appreciation. Whatever the relative contribution of the carry trade to current stock prices, it seems likely that the Dollar will continue to rise at the expense of the Euro. The horoscope of the Euro looks to be in a difficult condition for at least several more months, so that should be seen as bearish for stocks.
This week may see some rally attempt, especially in the early going, but the late week period could be vulnerable to more selling. Monday’s mood could benefit from the tail end of the favourable Venus-Neptune conjunction. Perhaps the EU will announce some bailout for Greece which will buoy spirits for a time over the weekend which will carry into Monday’s trading. Tuesday is hard to call as the Moon will set off the Saturn-Pluto square at midday. This is normally a bearish influence but the close proximity of Sun to Neptune could conceivably generate some buying. We should see at least one up day in the first two days of the week. The Moon approaches Rahu on Wednesday which could correspond to some irrational moods which in the present circumstance may signify buying. Thursday looks more dangerous as the Moon enters Capricorn and will conjoin Mercury opposite Mars. The aspect is not exact for either planet but there is a chance for a major decline either Thursday or perhaps more likely on Friday. Given the recent volatility, I would not rule out a 5% decline in a single day at some point this week, probably at the end of the week. Overall, the tenor of the week seems negative although we should watch out for one or two days of substantial gains. If these occur early in the week, then we could see SPX 1090-1100. As a result of Thursday’s sell-off, there is now a gap at 1089 to 1100 so there will be bulls who will be looking to fill. Even if that bullish scenario were to occur, the late week decline would likely take stocks back near current levels and probably below. If the rally is weaker, then I would expect SPX 1040 to be tested.
 Next week (Feb 15-19) looks mixed at best with gains more likely early in the week on the Venus-Jupiter conjunction. The bears may return as soon as Tuesday on the Moon-Saturn-Pluto alignment or perhaps Wednesday on the Mars-Saturn aspect. While some bounce is possible on Friday, our bias should be bearish to neutral here. The following week (Feb 22-26) should be more positive as the Sun approaches Jupiter and Mercury approaches Neptune. Generally the late week period looks more bullish. Early March seems fairly bearish with the approach of the Mars Direct station on March 10. However, it’s unclear if stocks will rally once Mars resumes its forward direction. It’s certainly possible although the Mars-Saturn aspect will still be close for another week or two afterwards. Late March and April generally look more positive. It’s conceivable we could see the bottom of this correction as soon as Feb 15-19 but March seems to offer more in the way of bearish configurations. If key resistance levels (SPX 1100) are not broken this week, then we could be in store for a protracted correction that lasts all the way into March. The rally into April could last from 2 to 4 weeks and could see the market challenge recent highs. I still don’t think they will be matched but let’s first see how far this correction goes. If it falls below SPX 1000 by March, then 1150 may well be too tall of an order.
5-day outlook — bearish SPX 1030-1060
30-day outlook — bearish SPX 1000-1050
90-day outlook — bearish-neutral SPX 1000-1100
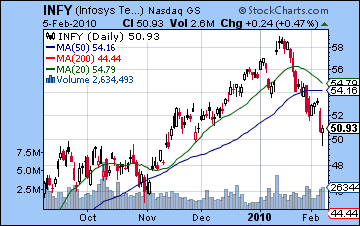
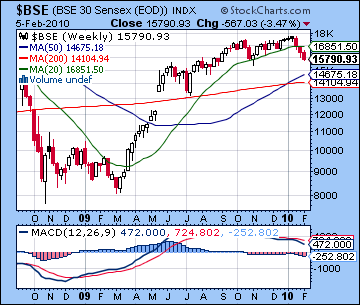
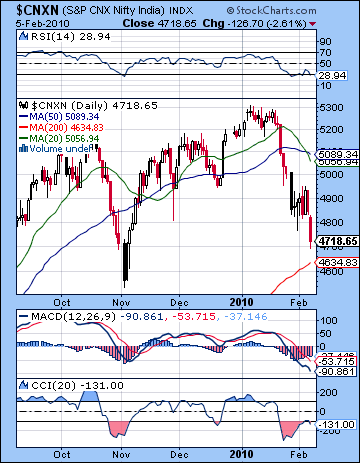 Stocks in Mumbai fell last week as concerns over European sovereign debt made risky assets like equities less attractive. Despite a midweek rally attempt, stocks declined almost 4% with outsourcers like Infosys leading the way as the Sensex closed at 15,790 and the Nifty finished at 4718. This bearish outcome was somewhat unexpected since I thought the Jupiter aspect to Saturn and Pluto might have provided more lift. Gains did occur, but were confined to the early to midweek period. While I was mistaken in the timing of the rise, I had been ambivalent in last week’s newsletter given the high concentration of aspects occurring within a short time. Monday was flat on the wide Moon-Jupiter aspect while Tuesday was negative as forecast on the minor Venus-Saturn aspect. I had thought we might see a change in direction on Wednesday’s Mercury-Rahu conjunction although the market managed another modest gain by the close. Contrary to forecast, sentiment worsened for both Thursday and Friday as much of the positive influence of Jupiter appeared to have manifested a little earlier than expected. Nonetheless, the correction entered its third week and offered further evidence for our working hypothesis that a significant market top may have been formed on the mid-January solar eclipse. Moreover, the failure of the market to rally back to Nifty 5000 was more empirical evidence that the correction phase may be protracted.
Certainly, the inability of bulls to take prices back to the rising wedge was a very bearish technical indicator. Now that prices have fallen through support in the wedge, there are fewer technical reasons for staying long in this market. Momentum has been shaken as we can see a "death cross" of the 20 DMA falling below the 50 DMA in the Nifty chart. Indeed, both of these moving averages are now falling. While we have seen similar bearish crossovers in November and in July, both occurred when the 50 DMA was still rising. This is no longer the case as the rally’s momentum has fallen away in recent weeks. Needless to say, daily MACD on the Nifty is still locked in a bearish crossover and continues to plumb the depths in negative territory. MACD at -93 is now lower than it was at the November lows. RSI at 28 is in oversold territory and matches its November levels. CCI at -131 is also showing no signs of altering its bearish trajectory despite a very brief foray above -100 earlier this week. The weekly Sensex chart continues to exhibit a bearish crossover for the 14th week in a row and is deepening in scope. Certainly, there is not much for bulls to take away from these charts as most indicators are pointing to more weakness to come. Now that the 4800 level has been breached, the next support level would likely be around 4600 which would match the November low and would approximate the 200 DMA. This ought to be fairly resilient to testing and will likely withstand the first attempt. After that, the July lows of 4000 (BSE=13,000) would be next in line for the market to test. If the correction lasts as long as the Mars retrograde period (March 10), then there is a real possibility that 4000 could be tested. There are certainly more difficult planetary patterns ahead in the coming weeks, but it is unclear if the market will fall back to that level. We shall have to watch for the strength of any rally attempts in the wake of all sell-offs in order to gauge the relative strength of the bulls and bears. Resistance is likely at last week’s highs of 4950 and perhaps also at the 50 DMA around 5090. Some rally attempt is likely next week so it’s conceivable that 4900 will be in play, although that would seem to be a bullish interpretation of the influences at hand.
 This week looks mixed with strength likely early in the week and declines more likely later on. Monday begins with a Venus-Neptune conjunction that ought to provide support for prices. One possible scenario is that there is some kind of EU bailout of Greece announced over the weekend that brings in buyers in the morning. With the Moon in Scorpio, however, the gains may not be durable. Tuesday could well be positive as the Moon is in alignment with both Mercury and Venus. This aspect is exact in the morning so that may augur more positively for the open. Wednesday is harder to call as the Moon is well placed in Sagittarius and safely past Pluto. This suggests a more positive mood but it is by no means clear. Thursday seems more difficult as Mercury is approaching its tense opposition aspect with Mars. While still four degrees away, it could be close enough to encourage selling. The Moon will conjoin Rahu so that is another sign of possible volatility. Friday’s holiday closing means that Indian markets will likely escape the worst of the Mercury-Mars aspect, at least until next Monday, the 15th. Depending on what kind of rally we see on the Venus-Neptune conjunction early in the week, the market could hang on to current levels by Thursday’s close. If the rally does not materialize, then watch for 4600 to be tested. I would lean towards the more neutral scenario, although not by much. Given the recent market direction, we should be prepared for more downside when it comes.
 Next week (Feb 15-19) will see a number of close aspects occurring early in the week which makes the direction harder to see. On the positive side, Monday and Tuesday will feature the twin conjunctions of Sun-Neptune and Venus-Jupiter. But at the same time, Mars will be in close aspect with Saturn, a very negative influence. It is possible that these opposing influences will simply resolve with little movement in prices, but I suspect we will see a sequence of negative and positive days in close succession. Monday may therefore have a greater chance of ending negative with Tuesday as a potential rebound day. While the midweek could be fairly strong, the end of the week looks more unstable. I would expect a down week overall. The following week (Feb 22-26) looks more solidly positive as Sun approaches its conjunction with Jupiter and Venus and Mercury applies to Neptune. March looks sideways at best with a genuine possibility of more declines as the Mars Direct station on 10 March will occur in close proximity to an aspect with pessimistic Saturn. The market may only begin a sustained rally towards the end of March and into April once all the faster moving planets have moved past their opposition aspect with Saturn. So assuming the correction lasts until March, we should see lows anywhere from 4000 to 4500 on the Nifty. After that, markets should attempt a rally which may extend into late April. At this point, I don’t expect it to exceed the January highs.
5-day outlook — bearish-neutral NIFTY 4600-4800
30-day outlook — bearish NIFTY 4000-4500
90-day outlook — bearish 4700-5100
 Worries over European sovereign debt pushed the Dollar higher last week as investors exited risky assets in search of safe havens. After some early week profit taking, the US Dollar Index closed above 80 for the first time since last summer. While I had anticipated a close above 80 at some point, my timing was off as I thought we would see gains occur earlier in the week. As it happened, the exact Jupiter-Saturn aspect produced dollar strength as stocks sold off. With increasing signs of a swift unwinding of the carry trade in the Dollar, there is even more bullishness here than I had expected. That said, the recent rise could be seen as the easier first part of the Dollar rally since it has yet to break above major resistance around the 81 level. The technicals are still very strong as daily MACD shows a positive crossover and matches the December top. Weekly MACD is in a similar bullish crossover for the ninth week in a row and has just crossed above the zero line. RSI at 74 is again in the overbought zone and equals the level reached in December. As an indication of the extent of this recent surge, the early week pullback stayed above the 200 DMA at 78.5. While the 200 DMA is still falling, it is about to form a bullish crossover with the 20 DMA. CCI at 162 is very bullish and recent consolidation did not knock it below the crucial 100 level. Further indication of the strength of the rally is found in the surging volume on the UUP ETF which continues to be several times its recent average. While this run-up has been impressive (and long overdue), I do think we could see some significant resistance around 81 which was the average price last summer. If the rally does take a breather this week or next, a retracement back to the December highs of 78 is quite possible. But generally, the trend is higher through March. The early March period could see the prices move decisively above resistance at 81, if it has not already done so by that time.
This week could see more upside with some declines going into midweek. That said, the USDX natal chart is not showing any particular signals due to the absence of close aspects. That means that the forecast this week is mostly indirect from reading the transits alone. This is necessarily going to be more speculative than it would otherwise be, so there is an even greater margin of error here. We should expect one or more likely two days of declines here as transiting Mercury comes under the aspect of natal Saturn Tuesday and Wednesday. Whether the declines manifest on those days remains to be seen but declines one day either way of that time frame would be the most likely outcome. The late week period does offer a minor aspect between transiting Mercury and the ascendant, so that gives some support to the notion of a wider pullback in stocks that would correspond to further Dollar gains. Next week looks more mixed with the prospect of solid midweek gains on the Venus-Jupiter conjunction. The last week of February looks more bearish as transiting Jupiter falls under the aspect of natal Ketu. If we top out in mid-February around 81 or 82, then the end of February could see a pullback under 80, perhaps as low as 78. Early March looks very bullish again so the Dollar should punch through resistance then. The Dollar will likely stay in rally mode until March 22 and the Sun-Saturn opposition. At this point, April looks quite bearish for the Dollar but it should rally significantly again in May.
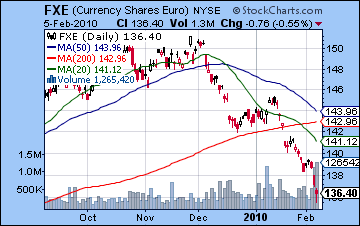 The Euro was the center of attention last week as widespread fears of debt default by Greece and Portugal sent investors running for cover. The Euro lost two cents on the week and closed below 1.37. I had expected it to perform better in the short term and possibly hold onto the 1.38 level, but effects of the Jupiter-Saturn aspect created an abundance (Jupiter) of pessimism (Saturn) about the creditworthiness of Europe’s lesser lights. While some bailout package may be cobbled together here, the medium term planetary situation does not indicate that it will be anything but a band-aid solution. The technicals are as bad as can be imagined as prices have fallen far below all three major moving averages. MACD (not shown) is well below zero and is in a negative crossover in both daily and weekly charts. Volume spiked on last week’s plunge as if to underline the urgency of the stampede. In the case of some snapback rally, 1.42 could be a significant resistance level. This would correspond to the 200 DMA and the December lows. Given how negative sentiment is on the Euro, that would seem to be an unlikely scenario. This week could begin poorly but some kind of bounce is likely in the midweek period. Watch for weakness to recur at the end of the week that might offset any preceding gains. There is a good chance the Euro will close lower by Friday, but possibly not by much. March may deliver the coup de grace for the Euro as Mars will station on March 10 near the 11th house cusp of the Euro natal chart. That makes it the most likely candidate for a close below 1.35 and perhaps as low as 1.30. As investors chose safety over risk, the Rupee lost ground last week closing at 46.8. Look for trades above 47 over the next week or two as the movement out of emerging markets continues.
Dollar
5-day outlook — neutral-bullish
30-day outlook — bullish
90-day outlook — bullish
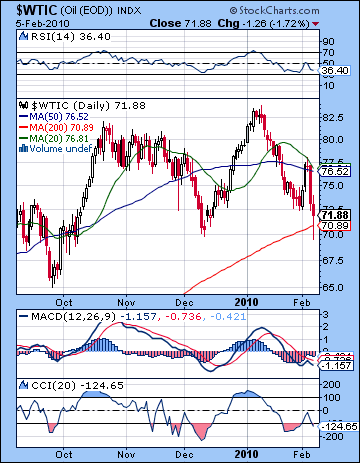 After a very volatile week, crude closed modestly lower on Friday just below $72. In last week’s newsletter I thought there was a chance that crude would test $70. That estimation turned out to be correct although my timing left something to be desired since the test occurred on Friday rather than early in the week. Wednesday’s Mercury-Rahu conjunction coincided with a peak of speculation as prices briefly exceeded $76. While Friday’s recovery off the $70 support level was impressive, the technical picture for crude still looks difficult. The midweek highs failed to break above resistance and the 20 and 50 DMA while both those moving averages are now falling. In fact, a couple more down days, and they will form their own death cross. Daily MACD is still in a negative crossover although the extent of the gap is lessening. RSI at 36 is bearish but we can discern a bullish divergence with the previous February low. CCI at -124 is bearish although it climbed as high as the zero line on the early week strength before falling back below -100. Resistance is still around $76-77 with $80-82 forming the next layer of resistance in case of a breakout higher. We will have to see if the $70 support level can hold in the weeks ahead as the Dollar is poised to continue its rally into March. At this point, it seems unlikely to hold up.
This week looks fairly bearish on Friday’s Mercury-Mars aspect although there should be some opportunity for gains before then. Monday’s Venus-Neptune will occur within striking distance of the Midheaven in the Futures chart so a significant gain is possible. Gains may be in the cards into midweek although this is harder to read. If Monday ends up being down, then that would boost the chances for significant rebound gains going into Wednesday. If Monday is higher, however, that may take some of the enthusiasm away from the bulls going into the midweek period. I would expect some significant bearishness to show itself by Friday at the latest. Not only is the transiting Mercury-Mars opposition bad news for speculation, but it also touches off several key points in the Futures chart, not the least of which is the Moon-Saturn conjunction. My best guess is that crude finishes below current levels, albeit perhaps still above $70. Of course, a huge decline is possible Friday so it might be big enough to break below $70 although I would not count on that outcome. Next week we will see more volatility with possible near term lows put in on Monday or Wednesday. Crude should rally after that going into late February and prices should again rise above $72. While we could see a return to weakness in March, crude seems to be in better shape than equities or other commodities like gold. Jupiter is transiting its 10th house here so that should offer a certain resilience in the face of any corrections. While it’s possible crude could go down to $60 over the next few weeks, that is not especially likely. After another sustained rally in April that could take it again over $80 and possibly even $90, crude oil will suffer a more significant decline starting in May.
5-day outlook — bearish-neutral
30-day outlook — bearish
90-day outlook — neutral
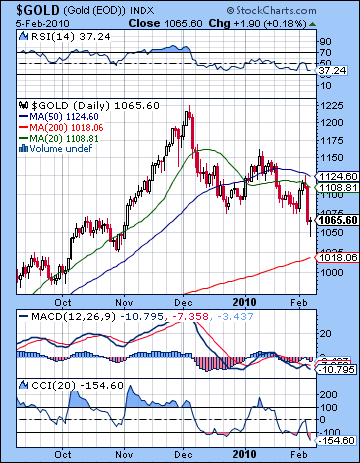 As risk aversion grew on Greek default anxiety, gold extended its slide as it closed down over 1% to $1065 on the continuous contract. The highlight of the week was Thursday’s stunning $45 drop which coincided with the exact Jupiter-Saturn aspect. I had been uncertain about last week and leaned towards a negative outcome but I failed to foresee such a severe drop occurring late in the week. The planetary correlate of this specific decline is still unclear, although it takes place within a more obvious bearish context of transiting Mars aspecting its own position in the GLD chart. While gold rallied above $1100 early in the week, it did not break above its 20 or 50 DMA, a sign of further weakness. We may well be seeing gold form a pattern of lower highs and lower lows here and once more investors recognize this bearish pattern, we could see a final capitulatory sell-off, perhaps in March. MACD is still in a negative crossover, although we may note a possible bullish divergence since MACD lows here match December lows. RSI at 36 is bearish and also equals levels seen in previous lows. If this level were to hold, it could signal a technical rebound in the short term. CCI at -154 is very negative and continues to have a bearish configuration since the midweek rallies did not push the line above zero. If overhead resistance stands at $1125 and $1150, support tells a more interesting story. Gold bulls were hoping for a bounce off of $1075 and they got it early last week. This confirmed the possibility of a bullish double bottom pattern with the December lows and opened the path towards another run higher. Unfortunately for them, the market had other ideas and late week trading took out support quickly. Even after bouncing off of $1050, Friday’s close below the key support level should give gold bulls pause going forward. While the breakdown does not preclude future rallies here, it further destabilizes expectations and creates the possibility for new lows. I would not rule out another run to $1100 in February, but a test of $1000 in March seems like a more likely scenario. There is quite a bit of support at $1000, so gold may well hold up — at least initially.
This week looks fairly gloomy for gold as the Mars transit to its natal position tightens through the week. There is some possibility for a significant gain, however, on the Venus-Neptune conjunction on Monday or perhaps Tuesday. Wednesday could also end up positive as Jupiter aspects both Mars and Saturn. So the most bullish scenario would see gold rise above $1100 again by midweek and then fall again as Mercury approached Mars by Friday. This bullish interpretation would see gold finishing near current levels of even a little above. I don’t think this is a likely outcome but it is within the realm of possibility. It seems more likely that any rise will be take gold to a point somewhere under $1100 and then the decline will push it lower than current prices. Gold will likely continue to trend lower until the last week of February where it should receive a noteworthy, if short-lived, bounce on the Sun-Jupiter conjunction. March will probably see the selling resume and take prices below $1000. We could see an interim low in gold formed on March 22 and the Sun-Mars-Saturn alignment.
5-day outlook — bearish
30-day outlook — bearish
90-day outlook — bearish