

- Stocks subject to declines through the week
- Dollar to move higher, perhaps above 200 DMA
- Gold will continue to slide
- Crude weaker but may stay above $70
- Stocks subject to declines through the week
- Dollar to move higher, perhaps above 200 DMA
- Gold will continue to slide
- Crude weaker but may stay above $70
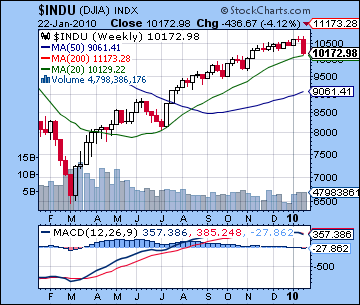
Stocks made an abrupt detour south in New York last week as markets were buffeted by tighter lending rules in China, the surprising election of Scott Brown to the Senate, and last but not least, President Obama’s ambitious program to reign in the banking sector. The Dow lost more than 4% to close at 10,172 while the S&P finished Friday at 1091. This bearish outcome was largely in keeping with expectations, although I certainly underestimated the scale of the retreat. As expected, the early week was mostly positive as global markets drifted higher on Monday during the MLK holiday in the midst of the Venus-Jupiter aspect. Wall St. then climbed to its highest close of the year on Tuesday as the S&P ended just a bit under 1150 as the Sun approached its aspect with Jupiter. Wednesday was more bearish, however, as sellers moved in just as the Sun-Jupiter influence was peaking. I had allowed for some bearishness in the afternoon due to the Moon-Saturn influence so even this result was not too surprising. Wednesday was another instance of the favourable planets perfecting their angular relationship on the day of a decline. Thursday and Friday both lived up to their bearish billing as we saw declines of 2% each day as the influence of Saturn predominated through aspects to Venus and then the Sun. While I did not foresee the full extent of this downdraft, I was relieved to see the market finally moving down as a correction appears to be underway. This move adds further confirmation to the possibility that the recent highs near the solar eclipse and the twin stations of Mercury and Saturn may have staying power. It’s still too early to say if they will withstand another rally attempt down the road in March or April, but last week’s action has substantially boosted the odds that the top for the year has been put in.
One good reason for leaning towards the bearish view of the market for the rest of 2010 is that the weekly Dow MACD has finally seen a bearish crossover. As a narrow slice of blue chip sentiment, the Dow had been the "last man standing" on the weekly charts and had been flat for several weeks. With a divergence of -27, the Dow MACD will give more confidence to bears in the days and weeks ahead to bail out of long positions. This is not to say that the market is headed straight down from here, nor does it preclude the possibility that the weekly MACD might still undergo a short-lived bullish crossover before the bottom falls out. The advantage to the weekly chart is that such crossovers are more reliable indicators of future direction than daily crossovers because there are fewer such moves. There was more bad technical news for the market this week as the S&P closed well below its 50 DMA, previously seen as a decent source of support at 1110. While Thursday closed sitting very close to that level, Friday plunged through it like it wasn’t even there, a possible sign of bulls getting cold feet and at least locking in profits. RSI at 36 has dived into negative territory and now stands at a lower level than previous lows around 40-42 in early November. This is a very bearish signal. CCI at -232 also fell below previous November lows and this is another sign that the rally is on very thin ice. The biggest volume day of the week was Friday, a down day, although it still saw fewer shares traded than another down day in mid-December. SPX 1091 is very close to the support level of the rising trendline that link the previous lows dating back to the summer of 2009. This also corresponds with a series of recent interim lows through December. If this level should fail to hold, the next critical support level may be the previous November low around 1040. This is only about 5% lower than current levels. One of the hallmarks of this rally or any rally is that higher highs are followed by higher lows. That is the most comforting fact that bulls require to keep their confidence and long positions intact. Once new highs are no longer forthcoming or lows are lower than previous lows, the rally enters a danger zone as more participants fear the market may be headed for a significant correction or at best, a protracted sideways movement. Certainly, new lows below 1085 would cause some nervousness since they would knock out the December lows. But as long as the market bounced higher again after a 5-10% correction, then the rally could resume. However, a potentially more crucial level would be at 1040 which marks the November low. This was more of a classic low in the rising trendline and if it was breached, it would likely cause more consternation about the long term viability of the rally. As a result of last week’s collapse after running up against previous highs, resistance is now that much stronger around 1150.
 Obama’s shot across the bow this week was a warning to Wall St that things will never be the same. The winds of change appear to be blowing as rumours are increasing that Treasury Secretary Geithner will be shown the door and now there is more talk that Fed Chair Bernanke is not a slam dunk for reappointment. All of this new populist tone was precipitated by the election of Republican Scott Brown in Massachusetts which took away the Democrats supermajority of 60 Senate seats. Not only is Obama’s costly health care overhaul now in trouble, but hopes for a second stimulus package have been drastically diminished. This means that all that free-flowing government money will likely be harder to come by in the next two years and this will have implications for investors. With deficits now coming under increasing scrutiny, the greenback is more likely to appreciate. The stronger dollar will likely have a knock on effect for stocks as the carry trade suffers a significant blow, even if Bernanke manages to keep rates near zero through the year. Less stimulus probably means less growth, and hence earnings may well suffer also. Naturally, stock prices will follow the trends in liquidity and earnings, and if they are drying up as a result of tighter spending controls in Washington, then that increases the chances for a significant correction in 2010. This is very much in keeping with my expectation that the market is headed down through much of the year, perhaps testing the March 2009 lows of 666 on the S&P. Certainly, last week’s stunning developments now create a plausible enough scenario that could accompany a second stock meltdown over the medium term. Moreover, the stresses I had been seeing in the horoscopes of Bernanke and the Fed appear to have been at least partially realized by this sudden move by Obama and his new right hand man, Paul Volcker to go after the big banks. As Obama is forced to play the populist card against banks and overly indulgent Fed bailout spending, it will seriously curtail the kinds of strategies they can attempt in the future. Even if Bernanke is reappointed at the end of January, he will be a much weaker position. With the stock market’s major enabler now more constrained, the bull rally would appear to have become more vulnerable. There is now a very real chance that Bernanke won’t be confirmed by the end of the month and if this happens it will probably take markets down further.
 This week looks generally bearish as Mars is the focus of several aspects through the week. Monday begins with Mercury in minor aspect with Mars. By itself, this aspect may not be enough to take stocks down further, but there is also a grand trine involving the Sun, Moon and Saturn in the afternoon. Any symmetrical pattern involving Saturn deserves close attention as it highlights the role of pessimism in the marketplace. While a negative outcome seems most likely, it is also possible that the exact three-point triangle formed by these planets could mark a very short term bottom, after which prices could rise. The alignment appears to become exact in the afternoon, so it’s possible prices could fall in the morning and then rise towards the close. It’s not inconceivable that prices could end up positive here, but given the generally negative bias on the week, I am reluctant to call Monday as a positive day. The negative impact of Venus opposing Mars will likely produce at least one down day on either Tuesday or Wednesday. While the aspect is applying and therefore more powerful on Tuesday, Wednesday may well be the worse day of the two given the Moon is opposite Pluto and square Saturn. This aspect is near exact in the afternoon, so prices could well weaken towards the close. Thursday may see the market free of Mars’ influence as the Sun is still two degrees away from its aspect. The Moon in Gemini will be approaching its conjunction with Ketu so that could introduce some rebound buying. That said, nothing particularly positive stands out here so it is something of a toss-up. Friday looks more negative as the Sun will closely oppose Mars. This could increase trading volume and prompt some heavy selling ahead of the weekend. The Moon will be applying to Mars in Cancer so that paints a picture of urgency. A more bullish scenario would see a gain eked out on Monday and possibly Thursday but even that wouldn’t be enough to take prices higher with December lows of 1085 broken by Friday. A more bearish and realistic scenario would suggest that the December lows will be broken early on, and that the November lows of 1040 may well be in play. I also would not rule out a more serious decline this week, perhaps to down to 1000, although that may be some wishful thinking on my part.
Next week (Feb 1-5) offers up some contrasting aspects that hint at a rebound, at least in the early going. In the absence of any clear negatives, Monday could be higher. Tuesday’s Venus-Saturn aspect seems more troublesome while the midweek period will feature a plausibly positive conjunction of Mercury and Rahu. The late week period could be dominated by the exact Jupiter-Saturn-Pluto alignment and this could well see prices fall again. That is more of a speculative call, however, since it is possible that stocks could rally up to this alignment. The following week (Feb 8-12) seems more negative especially as the week progresses. If we have a rebound in the first week of February, then the second trading week would more likely incline towards the negative, perhaps steeply. Thursday and Friday, (February 11-12) for example, stand out as a day or two where we could see prices fall 5%. Overall, it seems that the long-awaited correction has finally arrived and that prices will likely dip more than 10% overall, perhaps more like 15-20% depending on what kind of week we have here. In all likelihood, prices will have a negative bias through to mid-February at least. We should see a good rebound rally in late February on the Venus-Uranus and Sun-Jupiter conjunctions, but the Mars station on March 10 will likely correspond with at least several down days. Another rally is probable in the second half of March and into early April, so that may be the time of the most sustained rise. Given the likelihood of all this preceding negativity, however, it’s difficult seeing the market making new highs in April or May.
5-day outlook — bearish SPX 1040-1080
30-day outlook — bearish SPX 1000-1050
90-day outlook — bearish-neutral SPX 1000-1100
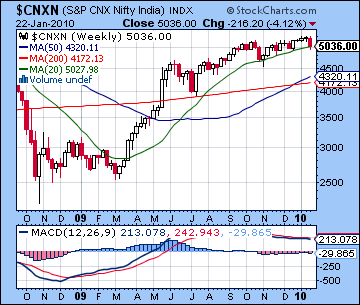
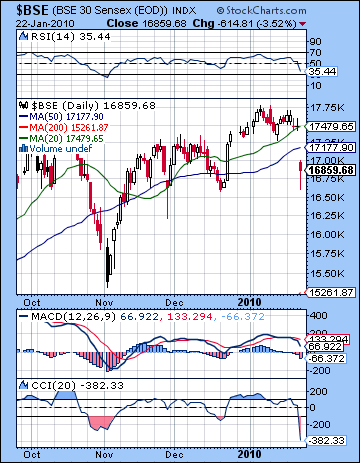 Stocks in Mumbai declined on worries that the Chinese central bank and RBI tightening could choke off the emerging recovery. After failing to reach the 5300 level early in the week, the Nifty closed down 4% to 5036 while the Sensex finished at 16,859. This result was largely in keeping with expectations, although I somewhat underestimated the extent of the bearishness. Certainly, our forecast for the week focused on early strength followed by weakness and that largely came to pass. While the early week minor aspects involving Jupiter helped to support prices, the market never managed to hold onto any gains. Nonetheless, Monday’s mostly flat performance was stronger than one might have expected given New York’s decline the previous Friday. Tuesday and Wednesday saw an extension of the stalemate near resistance levels of 5250-5300 as the Sun-Jupiter aspect could not spur investors to increase long positions. The inability for the early week to hit new highs increased the likelihood for declines overall. The late week Saturn emphasis was amply demonstrated as Thursday’s double dose of Saturn onto the Moon and Venus supplied the biggest loss of the week, just as indicated in last week’s forecast. Friday’s decline was more modest as the Sun-Saturn aspect had not yet come to full fruition. Overall, it was a good week for our working hypothesis that a top may be in place on the recent solar eclipse and twin reversals of Mercury and Saturn. It is still early days but if next week continues the correction as we expect, then 5300 will become an even greater resistance level over the coming weeks and months.
The technical situation of the market has clearly worsened as a result of last week’s sell-off. Thursday’s close to the 50 DMA might have brought in some buyers but Friday instead saw further erosion as prices slipped below that level without much hesitation. Moreover, support from the rising trend line from the July low was also breached on last week’s decline, another sign perhaps that a deeper correction is at hand. Daily MACD on the Sensex chart has turned negative although it has yet to challenge previous lows and remains above the zero line. RSI at 35 has fallen below the December lows but has yet to test the November low. CCI has meanwhile plunged to -382, a lower level than the November low, a reflection of the sharpness of the sell-off after staying in such a narrow trading range for an extended time. A somewhat more positive picture is found in the weekly Nifty chart where prices are still close to the 20 WMA. This could conceivably still act as a support level, as it did on the early November correction. Weekly MACD is still negative here as it has been recently, although it is still very much in positive territory. The market has broken down below immediate support here so we will have to see if it can stay above previous lows from December and November. Much of the psychology of the recent rally is rooted in the assumption that higher highs will be followed by higher lows. Pullbacks may occur, but they generally do not threaten to undo the preceding gains. It is important to note that despite the significant pullback last week, prices bounced off of their previous December lows. If these lows were broken, then it would send a bearish signal that the self-reinforcing cycle of higher lows was no longer reliable. So closes below 16,500/5000 take on a special importance here. Perhaps more significant would be a breach of the November lows at 15,500/4500 which would compel even more bullish players that the rally was in serious jeopardy. Given the astrological probability of more declines than gains over the next several weeks, it seems that the bulls’ mettle will be tested.
 This week seems again inclined towards the negative as malefic Mars predominates through a series of aspects. Monday will see the tail end of a Sun-Saturn aspect dovetail with an approaching minor aspect between Mercury and Mars. Given Friday’s sell-off in the US, it seems a negative result is most likely. There is nonetheless the possibility that some rebound could arrive later in the day since the Moon is exalted in Taurus. With Tuesday’s holiday closing, the Venus-Mars opposition aspect will likely figure prominently in Wednesday’s trading. This is not a positive aspect and although it is past exact, it should still be enough to act as a drag on prices. Thursday looks somewhat more positive, however, particularly in the afternoon so that could offer the best prospects for an up day this week. Friday may see a negative impact from the approaching Sun-Mars opposition. So there is good reason to expect at least two significant down days here, perhaps even three. What is more bearish is the fact that transiting Mars (16 Cancer) will aspect the Sun (16 Libra) in the NSE chart in the late week period. So even if Monday is negative, we should expect another big down day as the week progresses. For this reason the market will likely lose more ground here, and will likely close below 5000, perhaps significantly so.
 Next week (Feb 1-5) looks more mixed with a rally attempt possible early to midweek. Jupiter will form an exact alignment with Saturn and Pluto here so that could mark a possible interim trend reversal. Mercury conjoins Rahu on Wednesday and that is another potential source of gains as speculation could increase. The following week (Feb 8-12) tilts towards the negative again, although some gains are possible early in the week. Feb 12 and 15th stand out as noteworthy negative days. The third week of February features a tight aspect between Mars and Saturn which may also prove to be bearish although it should be noted there will be potentially offsetting positive aspects. Late February appears more bullish and this trend may continue into early March. Look for a significant decline in mid-March, however, as both the Sun and Mercury will oppose Saturn between the 18th and 22nd. Generally, it looks as though the market is in a correction phase here with shorter rally attempts likely through February. It seems unlikely that rallies will be able to match previous highs in the near term. We are maintaining our generally bearish outlook for 2010 with larger declines likely in spring and summer with late April and early May looking quite vulnerable as well as early August.
5-day outlook — bearish NIFTY 4500-4900
30-day outlook — bearish NIFTY 4500-5000
90-day outlook — bearish-neutral NIFTY 4500-5200
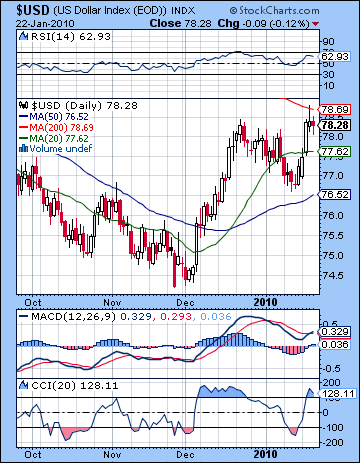 With prospects of lower US deficits as a result of greater Republican influence, the Dollar resumed its rally last week closing above 78. I had been more bearish here on the early week activation of the natal Saturn in the USDX chart but it seems the simultaneous aspecting of Sun, Venus and Jupiter were enough to offset any negative influence. Interestingly, the Dollar briefly traded at its 200 DMA on Thursday’s Venus-Saturn aspect before settling somewhat lower on Friday. This bullish outcome preceded much of the anticipated Mars action this week which is also likely to be dollar-positive. The technicals generally support a continuation of the rally here as daily MACD is once again in a bullish crossover and is in positive territory. RSI at 62 is rising, although it shows some signs of slowing as a bearish divergence is appearing with respect to previous highs. CCI is over 100 now and further increases this week will probably keep it in the bullish +100 area. The weekly MACD is still in a bullish crossover and has yet to move above the zero line. The recent pullback stayed above the 50 DMA at 76.5 so this should be seen as a worse case support level going forward. If we do see the Dollar rally again this week, the 200 DMA around 78.7 will bear close attention as it could become a trigger for profit taking. If it does not and prices continue to rise through it, that would be a very bullish indication.
This week again looks broadly positive for the Dollar as a series of Mars aspects will likely produce risk aversion. There is a more likely chance of a negative day occurring early in the week as Mars will oppose the natal Jupiter in the USDX chart. This will happen very close to the Venus-Mars opposition, so perhaps the down move will be limited. The midweek period looks more wholly positive, with Tuesday looking somewhat better than Wednesday since the Moon will be angular in the USDX chart. While Friday’s Sun-Mars opposition ought to support prices, Mercury will be afflicted in the natal chart. This could introduce a bearish element into the late week period although a gain is still perhaps the most likely outcome. On balance, the week should be positive with 79 quite possible here, perhaps higher. February looks more mixed with the first week looking generally bearish.
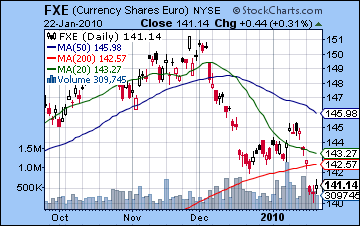 The Euro lost more ground this week as it broke below its 200 DMA before closing near 1.41. I had been more bullish, especially regarding the early part of the week. I had expected the combined energies of the Sun and Venus in aspect with the ascendant to make the Euro more desirable but it seems as if the Saturn-Pluto square had other plans. After its recent rally, daily MACD has again turned negative while RSI at 33 is very bearish. Now that it has broken below key support, the next key level would probably be around 1.38-1.39 which corresponds to the June low. This week could well see more selling on the various Mars aspects. Monday may offer some counterweight, however, as transiting Mercury will conjoin the natal Sun. The outlook is quite poor for the Euro this year as the EU will have to grapple with the possible sovereign debt defaults of Greece, and perhaps other larger economies such as Spain. The late April and May period looks especially significant as Saturn will conjoin the natal ascendant. The Rupee declined off its recent highs last week closing at 46.2. Watch for further retracement this week.
Dollar
5-day outlook — bullish
30-day outlook — neutral-bullish
90-day outlook — bullish
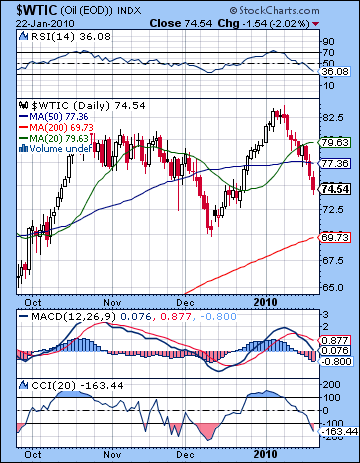 Amid concerns of falling demand, crude oil continued its recent slide last week and closed near $74. This outcome was largely in keeping with expectations as the early week strength on Jupiter’s influence was no match for Saturn later on. As it happened, only Tuesday was higher, as crude edged towards $80 before sellers returned Wednesday and ended any rally possibility. As expected, the late week losses were fairly steep and pushed prices below the 50 DMA for the first time since the December correction. The technical picture is looking increasingly negative here as daily MACD is in a bearish crossover and is on the verge of entering negative territory. RSI at 36 is falling but has yet to match the December low of 32 while CCI at -163 appears to be entering a bearish phase. Weekly MACD is still fairly flat although one more large down week would likely render more solidly negative. The next level of support is likely around $70 which corresponds to the 20 DMA and the previous December lows. Any closes below this level would be very bearish indeed, so it is something to pay attention to this week. If crude can stay above $70 then it can avoid the trap of lower lows and continue to give hope to the bulls that there is more upside to come.
This week should see more downside as the raft of Mars aspects are likely going to make commodities an uncomfortable place to be. At the same time, Monday and Tuesday offer some prospect for gains owing to the Mars aspect to the natal Jupiter in the Futures chart. This aspect produced a significant up day when it was last active so some kind of strength seems likely here. Owing to some offsetting influences, there is a good chance that crude will not break below $70 this week. Next week looks more positive as transiting Jupiter will aspect the natal Moon-Saturn conjunction. February seems fairly mixed at this point so it seems unlikely that will be undergo a major retracement. I would therefore not rule out another run above $80 towards perhaps $90-92 in March and April. Crude will likely slide after that into May and June on the Saturn Direct station which occurs in close opposition to Uranus. This decline will likely be greater than anything we see over the next month.
5-day outlook — bearish
30-day outlook — bearish-neutral
90-day outlook — bearish-neutral
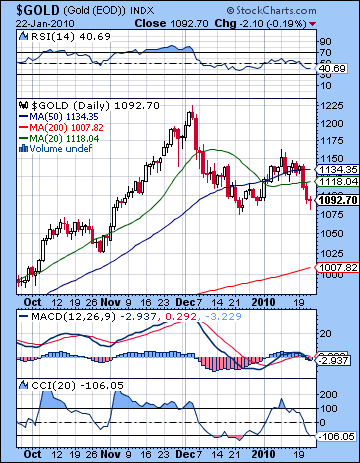 As the Dollar rose on changing political realities in the US, gold fell sharply before closing at $1092 on the continuous contract. I underestimated the extent of bearishness here, mostly on the mistaken belief that Tuesday’s gain would be quite large. As it turned out the gain was tiny and while Tuesday was in fact stronger than Wednesday as predicted, gold promptly sold off after its single up day. The double dose of Saturn to the Sun and Venus took prices down accordingly, as gold below both its 20 and 50 DMA. Its daily MACD has once again formed a bearish crossover and is below the zero line. After its brief stint above 50, RSI at 40 is falling again while CCI at -106 may be entering an extended bear phase. Weekly MACD shows a bearish crossover for the fourth straight week although the bars are still fairly small. As weak as gold has been, bulls may take some solace in the fact that the rising trend line from the lows in late 2008 runs right through current levels. In that sense, gold is at a crossroad of sorts here since a break down below this support line would be a bearish signal that could spark more selling. The next support level would then be around $1050 which corresponds to the the rising trendline dating from the spring lows of 2009. After that, the 200 DMA sits around the key psychological level of $1000 and this would also tend to bring in more buyers. Gold bulls are no doubt hoping that current prices hold up here as this would form a double bottom around $1080-1090 and would set the stage for another rally. Certainly, if prices do not fall next week on the plethora of Mars aspects, it would greatly enhance the bullish case for gold. I don’t think it is likely, but it is important to be aware that there could be a rush of buyers at these levels.
This week looks like another down week for gold as Mars will aspect both of the key planetary significators for gold, Venus and the Sun. Monday looks difficult as the Sun will still be range of the Saturn aspect, although perhaps there will be some improvement as the day goes on. Tuesday will see Venus move into an aspect with Mars. Wednesday could see a rise on the Moon-Jupiter aspect as Venus will be past the worst of Mars by then. That said, it is possible these days could invert, with Tuesday being positive and Wednesday negative. I don’t think this is likely but with many aspects occurring close together, it is possible. Thursday and Friday both seem negative as the Sun approaches Mars although Thursday looks worse. Overall, there is a good chance that gold will break below support at $1080 here and will call into question the double bottom pattern. Actually, we could well see $1050 here or lower since Mars is debilitated so its aspects are that much nastier. Gold looks weak to mixed until the second half of February so it could bottom out as low as $1000 before attempting another meaningful rally. March looks more mixed but watch for weakness to intensify as we move into April. Even with a decent rally in late February, it would appear likely that the highs for the year are in and that gold will likely be primarily bearish from here on out. Some recovery is likely in the second half of the year but it is unclear how strong a rebound this might be.
5-day outlook — bearish
30-day outlook — bearish
90-day outlook — bearish