

- Stocks mixed with key aspect on Monday
- Dollar to strengthen through the week
- Gold with bearish bias
- Crude oil mixed
- Stocks mixed with key aspect on Monday
- Dollar to strengthen through the week
- Gold with bearish bias
- Crude oil mixed
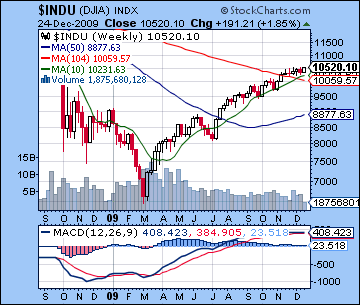
Santa Claus arrived on Wall Street last week bringing pleasant tidings of falling jobless claims and rising durable goods orders. This yuletide fuel pushed the S&P to new highs for the year before closing 2% to the better at 1126 while the Dow finished at 10,520. The extent of the gain was unexpected, as I thought any buying would be more confined to earlier in the week and the tight Venus-Jupiter-Neptune pattern. While Monday was indeed the strongest day of the week as I thought it might, the bulls continued to rule the roost in advance of the Christmas holiday. The lack of any pullback Tuesday was perhaps a sign that we would be in for a positive week as none of the potential negatives manifested on time. I had expected a positive outcome from Wednesday and that’s what we got as the Mercury-Rahu conjunction provided further support for prices. Thursday was again higher despite the difficult Moon situation in Pisces opposite Saturn. This was particularly disappointing given the recent trends in Saturn’s affliction to the Moon. One possible explanation is that the Mercury-Rahu conjunction was close enough to still outweigh any negative transitory Moon effects. Overall, the week showed the continued strength of the Jupiter-Neptune conjunction, even as it began separating and presumably weakening after December 21st. It also revealed the Mars retrograde cycle as a harder-to-predict medium term influence where its manifestations resist attempts at exact timing. Like other medium term influences, the Mars retrograde cycle will require short term triggers to release its energy.
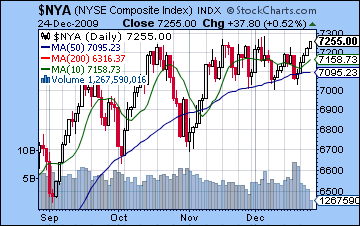
As the year draws to a close, the market has made new highs on most of the indexes. Previously lagging indexes such as the NYSE Composite ($NYA) or Russell 2000 have now caught up with the narrower blue chip indexes such as the Dow and have added to the bullish case. We should note, however, that while the closing prices were highest on the Dow and $NYA, neither of those indexes made new intraday highs. And we would do well to wonder how much emphasis should be placed on highs made on low holiday volume before Christmas? I think it’s foolhardy to completely ignore it, but new highs made under these circumstances deserve an asterisk and require further confirmation when volume has returned to normal. Plus the new highs aren’t sufficiently beyond previous November highs to discard the notion of a double or rolling top in some indexes. At the same time, it may be worth noting that upward price channel resistance level is about SPX 1140 so it is still conceivable that the market could go there before correcting. MACD on the S&P shows a bullish crossover as a result of Thursday’s trading and is now trending higher although still well below its November highs. RSI at 62 has also recovered somewhat although it, too, is below November highs. It has nonetheless interrupted its immediately bearish divergence pattern of falling peaks. Upward momentum remains in place as the key moving averages are still rising and even the ever-flattening weekly Dow chart is still showing a positive MACD, another important piece of bullish evidence. Key support levels are the rising price channel at 1080 with perhaps fewer buyers coming in if we drop to the 50 DMA at 1090. Below that, the previous low of 1040 could become support and after that we find support at 990-1000. With the prospect of some year-end window dressing this week, one cannot rule out the possibility that the market could run-up to the upward channel resistance at 1140 . I still don’t think this is the most likely scenario, but last week’s action nonetheless increased the chances of this more bullish short term outcome. Such a development would therefore increase the likelihood for sideways movement through January with more modest dips to 1040-1080 before the market might reach new highs of 1250 or more by March or April. Again, I don’t see this as likely but it is nonetheless possible, especially if some of these upcoming negative planetary patterns do not deliver. The more likely scenario is for a deeper pullback through January to 950-1000 perhaps before the market trends higher again into spring.
 The Dollar is still a key to this market as the inverse relationship is likely to prevail at least in the medium term. Last week was somewhat anomalous as the Dollar held steady as stocks rose. This could be explained in terms of a low volume stock rally that really isn’t representative of wider financial realities. We will have to wait until after Christmas and probably into early January to see how the renewed strength in the Dollar plays out, particularly as its threatens the lucrative carry trade. As long as the Dollar remains above key support levels around 76-77, it is likely to continue to strengthen further. This will likely be corrosive for stock prices in the medium term as some speculators will be forced to unwind their carry trade plays. Another potentially important factor are rising bond yields as the 10-year treasury is now fast approaching 4% and the price of the 30-year treasury has fallen to its summer lows. Usually rising yields are a sign of optimism as inflation worries from the promise of economic recovery push down prices. Several commentators have noted, however, that part of the rising bond yield phenomenon may be better explained by the market being swamped with fresh supplies of debt from the government stimulus that demand cannot readily absorb. It is important to remember that rising yields will make bonds more attractive as an asset class and will thereby become more competitive with equities. So rising bond yields could be another factor that will tend to weigh on stock prices in the medium term. Keeping in mind the upcoming turbulence indicated in the horoscope of the Federal Reserve in the coming weeks, there is still very good reason to be cautious about stock prices here as the internal dynamics of these financial markets work themselves out.
 This week will be an important test of the market’s probable direction under the Mars retrograde cycle that began last week and will continue into March. As unexpected as it was, last week’s positive outcome did not nullify the potential bearishness inherent in this Mars cycle since there were plausible offsetting factors. This week will therefore provide another glimpse into what the financial world may look like in the wake of the Jupiter-Neptune conjunction, as greater angular separation is likely to translate into more market weakness. In addition, Mercury has added another possible source of bearishness to the mix since it went retrograde on December 26. The early week period looks to be more critical here as Venus activates the Saturn-Pluto square aspect on Monday and Tuesday. This alignment is potentially very bearish and could take markets down significantly. Recent activations of the Saturn-Pluto aspect have so far disappointed on the downside so we should be prepared to be underwhelmed in that regard. A modest 0.5-1% decline would therefore suggest that the situation has not changed significantly from the past several months of range bound trading. But if we see something more than 2%, then that would support the notion that a larger correction is in offing. Monday seems like the worst day of the two, although the open could well be positive as the Moon forms an aspect with Jupiter. I think there is a good chance for significant decline over these two days. Tuesday is harder to call as Mercury, now retrograde, again conjoins Rahu (North Lunar Node). This conjunction coincided with a gain on Wednesday last week so I would not rule out a similar outcome here. The end of the week looks more positive as the Sun, Venus and Pluto form a helpful alignment. Wednesday may be the more positive as the Moon enters Gemini and could siphon off some positive energy from its aspect with Jupiter. Thursday seems more bearish as the Moon moves towards its aspect with Saturn. Overall, the market should be lower although if the early week sees only a modest decline or better, then we could well move higher still, perhaps towards the upper trendline. A more likely outcome is a decline within the recent trading range followed by some rebound.
Next week (Jan 4-8) looks somewhat bearish on Monday’s inferior conjunction of Mercury and the Sun. This often correlates with negative sentiment although one potentially offsetting factor here is the minor 45 degree aspect between Venus and Jupiter. Tuesday looks more bullish on the Mercury-Venus conjunction while the later week points to more selling on the minor aspect between the Sun and Mars. The following week (Jan 11-15) looks more clearly negative on the triple conjunction of Sun, Venus and Rahu on January 11. If it hasn’t happened by this time, then this pattern may provide enough bearish energy to shake the markets out of their recent trading range. Saturn’s retrograde cycle also begins on the 13th so that is another factor that could weigh down sentiment. The second half of January seems more mixed to positive as Mercury returns to direction motion and Jupiter approaches its aspect with Pluto. This could well mark the beginning of a more sustainable rally after a decent-sized correction. The four-planet alignment of Mars-Jupiter-Saturn-Pluto that occurs on February 10 could also mark a significant point in the market, possibly an interim high.
5-day outlook — bearish SPX 1100-1130
30-day outlook — bearish SPX 950-1000
90-day outlook — bearish-neutral SPX 1050-1150
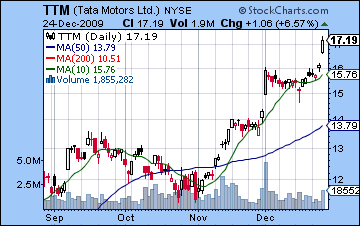
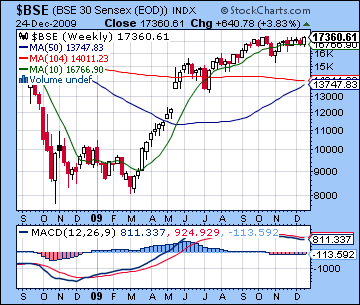
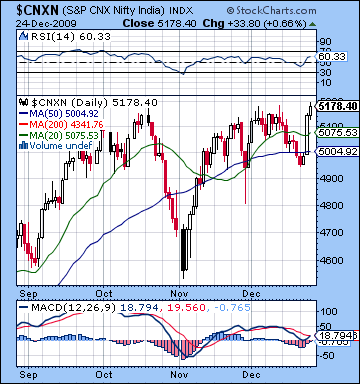 Stocks in Mumbai rallied almost 4% last week on an encouraging government GDP forecast. Automakers (See TTM chart) led the way as the Sensex closed at new highs for the year at 17,360 while the Nifty ended at 5178. I had expected more bearishness, especially later in the week in the wake of Monday’s apparently positive Venus-Jupiter aspect. As it happened, Monday actually saw a modest decline with buyers moving in tentatively on Tuesday and with more enthusiasm on Wednesday. While Venus was still fairly close to Jupiter going into the midweek, the bullish outcome came well after the aspect was exact, and hence a reminder that aspects may not always manifest when mathematically at their closest pass. Nonetheless, Wednesday was higher as forecast as the Moon benefited from the influences of Jupiter and Uranus. Thursday was also higher despite the affliction of the Pisces Moon by Saturn. While this aspect had produced losses on previous alignments, it seems to have been offset by the lingering positive effects of Monday’s Jupiter-Neptune conjunction. Indeed, much of the bullishness appears to have derived from the strength of this aspect, even with Mars turning retrograde in tense aspect with Mercury and Rahu. As disappointing as this outcome was, it does not come as a complete shock. It can be accounted for through a re-interpretation of the dominant energies in the sky. Certainly, the Jupiter-Neptune was a very strong combination and as a long term planetary influence it had lay behind much of the 2009 rally. It is indeed so strong that it has continued to buoy prices even after its exact conjunction. It’s still less than one degree past, so that is obviously close enough for some residual hopefulness to manifest in the market. Similarly, the Mars retrograde cycle is a medium term influence so it, too, may have a fairly loose window of manifestation. Since Mars moves backwards in the sky until March, we have only started the retrograde cycle and so we may have yet to see how bearish it truly can be.
With the new highs for the year, the market technicals made a significant improvement. Volume may not have been particularly strong, but new highs are nonetheless important milestones. That said, the highs were not confirmed on the Nifty on an intraday basis so one could still make a reasonable case that the market remains range bound. Another sign of relative vitality is that prices bounced off the 50 DMA on Monday and went back up. The ability of bulls to step in so vigorously after such a mild decline to a high support level is testament to their continued conviction. Prices are now well above the 20 DMA and MACD has turned higher. While this is an obvious sign of improvement, we should note that it has yet to form a bullish crossover and until it does, skepticism may be the best position. The negative divergence is now present in spades as new highs have not been matched by new MACD highs. RSI at 60 fared somewhat better as it has matched the levels registered from November highs. Lest one get carried away with bullish hysteria, RSI is still lower than the September and October highs. Perhaps most damaging to the bullish case is the weekly BSE still shows MACD falling and in negative crossover even after last week’s solid gain. This is a clue perhaps that momentum has not been sufficient to push prices significantly above recent narrow ranges. It will be important if the Nifty can close above 5200 for more than a day since that may persuade more new money to come into the market for a new potential leg higher. After last week’s move higher, the first line of support appears to be just under 5000, with another line near 4800 corresponding to a rising price channel. Below that, 4350-4500 may also bring in buyers in the eventuality of a deeper retracement. This would roughly correspond with the 200 DMA. Overall, the market seems poised to move one way or the other, as it cannot stay in this fairly narrow range forever. Last week’s up move has given new hope to the bulls that the breakout will be to the upside and certainly there is increased technical evidence for that view. But investors may be excused for being skeptical of any possible move higher until 1) the Nifty has a bullish crossover in daily MACD and the Sensex weekly MACD can move back into positive territory.
 This week is also holiday-shortened so trading opens on Tuesday and the Venus-Pluto conjunction. This seems more likely to produce a pullback since Venus could act as a trigger for the Saturn-Pluto aspect. Saturn-Pluto has so far disappointed on the downside so we should be fairly cautious about expecting much of a move here, but it is still possible. An additional factor in the mix is that Mercury, now retrograde, conjoins Rahu during the trading day. This conjunction occurred last Thursday and coincided with a gain, so we should be mindful of that possibility. Nonetheless, Mercury’s retrograde cycle (starting 26 December) may transform that aspect into something more unexpected and disruptive. Wednesday will see Venus still within range of Pluto and the Moon forming aspects to Mars and Rahu so those are two short term influences that favour the bears although probably not as clearly as Tuesday. A late session rally is also possible here so that could conceivably tilt the balance back in the favour of the bulls. Thursday seems more positive as the Sun, Venus and Pluto form a helpful alignment. At the same time, I am not certain the gain will arrive intact since the Moon will be vulnerable to Saturn’s aspect near the close of trading while Mercury is in a close minor aspect with Mars. I would lean towards a positive close here, but it’s not at all certain. Overall, the week should be negative, but only as long as Tuesday sees a significant decline of at least 2%. If Tuesday is not negative, then that increases the likelihood for more gains and indeed of a larger move higher, perhaps towards 5350 on the Nifty.
 Next week (Jan 4-8) could be mixed with a bearish bias as we find another important test of the bulls on the inferior Sun-Mercury conjunction which occurs in close proximity to a minor Venus-Jupiter aspect. The Sun-Mercury conjunction is often bearish so the presence of Venus and Jupiter may work to offset the worst of the negativity. While I don’t favour a gain here, if the market can go higher on this aspect it would increase the chances for an extension of the rally. Tuesday also presents an arguably better possibility for gains as Mercury conjoins Venus. The later parts of the week seem more bearish as both Sun and Venus will come under the minor aspect of Mars. The following week (Jan 11-15) looks more bearish, at least in the early week, as the triple conjunction of Sun, Venus and Rahu occurs at 21 Sagittarius. Saturn also turns retrograde at this time so that is possible sign of a new emerging trend. My best guess is that it could mark some kind of interim low as late January looks more positive with Jupiter activated by both Sun and Venus and Jupiter gradually approaching an aspect with Pluto in early February. To summarize, the predominance of recent bullish energy has largely nullified various bearish planetary configurations. While I believe there is still good reason to expect some kind of significant pullback here, it is conceivable that we will merely go mostly sideways for another few weeks before making another move higher into spring. This is a more bullish scenario where any down moves into January are limited, perhaps to just 4800, before the market trends higher, perhaps towards 5500 by April. A more likely scenario would have a deeper correction to 4500 or below in January before the market rallies into spring. Given the deeper correction, however, it is less likely to make new highs above current levels.
5-day outlook — bearish NIFTY 5000-5200
30-day outlook — bearish NIFTY 4500-4800
90-day outlook — bearish-neutral NIFTY 4800-5500
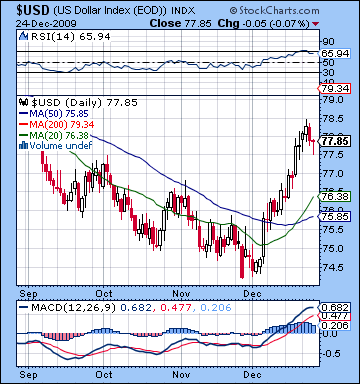 The Dollar eked out another gain last week as prospects for economic recovery bolstered confidence in the greenback as the USDX closed around 78. Interestingly, the gains were confined to early in the week as the Venus-Jupiter aspect brought the bulls out as optimism for a quick recovery prevailed. While I thought we would be net positive over Monday and Tuesday, I did not expect this amount of bullishness. The late week turned out to be more bearish as optimism brought about the old divergence between the Dollar and equities with good economic news fueling stocks but weakening the Dollar on rising deficit fears and the higher debt levels implied by the new Senate health care package. Despite the late week decline, the Dollar held up quite well and now stands well above its 20 and 50 DMA as well as the support levels from the falling price channel dating back to its March highs. The 50 DMA at around 76 is therefore a critical support level and may be tested on any pullbacks we see in the weeks ahead. While I think the Dollar will soon rise beyond this range, it should nevertheless be seen as a bearish scenario for the Dollar in the event of a possible stock rally and further inflation fears. The next resistance level may be around 79-80 and its 200 DMA and after that, perhaps around 82-83. MACD is still very positive and mostly flat although it is finally well ensconced in positive territory. MACD also enjoyed its third straight week of a bullish crossover on the weekly chart, which is perhaps a more reliable bullish indicator for the medium term. RSI at 65 is still quite bullish although it has come down off its recent levels in the overbought zone. Overall, the technical picture for the Dollar is still quite bullish and points to a continuation of the rally into 2010.
This week is likely to see more gains for the Dollar as the Venus-Pluto conjunction on Monday is likely to see a sell-off in equities that could spark a flight to quality. Tuesday could go either way although I would lean slightly towards a positive bias as the Moon opposes the natal Mercury-Uranus in the DX chart. Wednesday looks more negative as the Sun falls under the aspect of natal Rahu so that is likely to coincide with a rally in equities. Friday looks positive again as the Moon will activate the natal Jupiter in the DX chart, especially in the afternoon. So it’s likely the Dollar will move higher, perhaps on three out of four trading days. If the early week move is big, the Dollar may even approach its next resistance level of the 200 DMA around 79-79.5. Next week (Jan 4-8) looks like more good news, although this time it may be the beneficiary of renewed optimism for the US economy as opposed to pessimism from a flight to quality. If anything, the first week of January looks more positive than late December, so it is possible we could see a 2% move higher here, perhaps lifting it back above 80. The Dollar will likely suffer a meaningful correction after January 13th and the beginning of the Saturn retrograde cycle. The medium term outlook is still generally bullish.
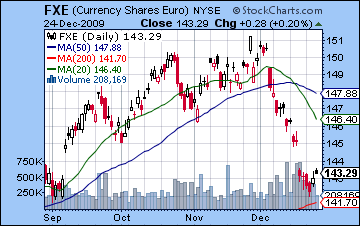 The Euro was mostly unchanged on the week as it closed near 1.43. While I was mistakenly bullish in the early week, my general sense of a pause from recent losses was on the mark as the Euro at least managed to resist its recent strong downward trend. The absence of any gains on Monday and Tuesday was somewhat puzzling given the double aspecting of the natal Moon by Venus and Jupiter. Perhaps the negative aspect from Mars to the transiting Mercury was enough to offset the otherwise benefic influence. In any event, the late week was stronger on the Mercury-Rahu conjunction. Even with the modest rebound, the technical situation of the Euro still seems difficult as MACD remains in a bearish crossover and is now deep in negative territory. Weekly MACD is also in its second week of a bearish crossover which supports the notion that this Euro correction will not be a short term affair. RSI at 33 shows signs of a bounce but it has a long way to go before turning bullish. This week looks like more trouble for the Euro as the Venus-Pluto conjunction will set up close to the 4th house cusp. That said, I think the first week of January will be more bearish so even if the Euro managed to stay flat it may well fall again next week, perhaps right down to support at 1.40-1.41. The Rupee was stronger last week, mostly on Thursday’s gain and the Q3 GDP numbers as it closed at 46.5. These gains are unlikely to hold this week so it may move down to 47 once again. 48 is definitely in the cards in early January.
Dollar
5-day outlook — bullish
30-day outlook — bullish
90-day outlook — bullish
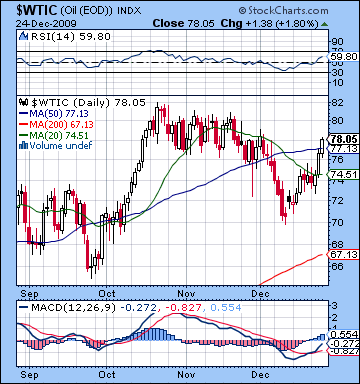 Crude oil extended its recent winning streak last week as it closed near $78. This result was more bullish than expected as I thought the upside of the Venus-Jupiter aspect would be offset by the manifestation of Mercury with Rahu and the Mars retrograde leading to a more mixed outcome. Even more puzzling was that the gains arrived after Monday and the supposedly positive influence of Venus and Jupiter. Monday ended lower while the key aspects were at their closest pass, a paradoxical situation to be sure. Despite my misinterpretation of the intraweek specifics, the end result was not entirely out of left field since Jupiter and Neptune were still in close conjunction and both formed a very supportive aspect with the ascendant of the Futures chart. The rally was strongest on Wednesday and Thursday as transiting Venus (3 Sagittarius) conjoined the natal Ketu. The technical outlook for crude improved somewhat last week as MACD now enjoys a bullish crossover and is moving higher. RSI at 59 is also moving higher and more importantly stands at a higher level that previous highs, suggesting a bullish divergence may be underway. Both of these indicators would tend to support the likelihood of higher prices in the short term. Crude closed just above its 50 DMA, indicating a possible break above a key resistance level. As positive as the technical picture looks, we should nevertheless note that on a weekly basis, the technical picture has not fundamentally changed. MACD has yet to form a bullish crossover. This is a reflection to the relatively brevity of the recent rally but it does introduce a measure of caution about the medium and long term. As before, its recent highs around $81 should be seen as a fairly strong resistance level.
This week may well see the continuation of the rally, although the outcome will likely hinge upon what Monday’s Venus-Pluto conjunction will bring. I anticipate this aspect will create pessimism that could see a significant sell-off but there is more uncertainty there given the lingering bullish effects of Jupiter and Neptune in the crude Futures chart. Generally Tuesday and especially Wednesday look more positive as the Moon enters Taurus and the first house. Thursday may be less clearly positive as early hopefulness may wane through the day. If Monday is down, then the week will likely be mixed with a bearish bias with crude finishing in the $76-78 range. If Monday is higher, then that greatly increases the chances for a run-up to resistance levels of $81. Next week (Jan 4-8) looks more clearly bearish on the Sun-Mercury conjunction on the 4th. The following week also suggests a bearish bias as Saturn turns retrograde on the 11th but crude may bounce after that. If we see a more bullish scenario unfolding then we may see a double bottom put in with a January low around $70 before crude moves higher again. Given the probable strength of the Dollar in 2010, I don’t see this as a likely outcome but it is certainly possible. A more bearish scenario would have crude correct to $60 in January with a longer, slower ascent back to $80 until the spring.
5-day outlook — bearish-neutral
30-day outlook — bearish-neutral
90-day outlook — neutral-bullish
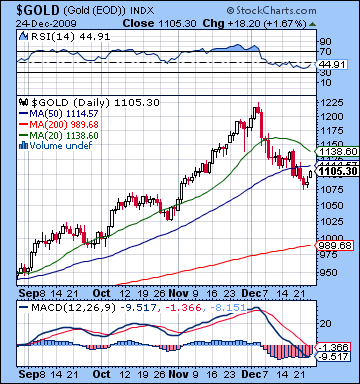 With the Dollar continuing its recent recovery, gold lost ground for the fourth week in the row closing at $1105. While this bearish outcome was in keeping with expectations, the early week Venus-Jupiter aspect correlated with losses instead of gains. Bulls took control on Wednesday and Thursday as the approaching Venus conjunction to the natal ascendant appeared to counteract any negativity from the Sun-Pluto conjunction. While gold was only down slightly, it revealed its more fundamental weakness as it did not display any of the strength of other commodities such as crude oil and the rally in equities. Its technical position is still vulnerable as MACD remains in a bearish crossover and is still falling. RSI at 44 is still bearish although it has now turned higher. The 20 DMA has now turned lower and Thursday’s closing price is now below both the 20 and 50 DMA. One possible bullish indicator is weekly MACD has yet to turn negative even with the recent declines, although that is perhaps less surprising given the huge speculative run-up that gold enjoyed through November. Significant support may be found from the main rising price channel at $1020-1030. Secondary support is likely around near current levels which is fairly close to the 50 DMA at $1114. Resistance is likely around the immediately preceding peak around $1140-1150.
This week is likely to have a bearish bias also with the Venus-Pluto aspect on Monday and Tuesday likely to make gold less attractive. One important mitigating factor is transiting Jupiter (2 Aquarius) still in close trine aspect with natal Venus (1 Libra) so that could offer some support through the week. If Monday happens to be up, then the week will likely be positive overall as the Sun and Venus approach minor aspects with the natal Jupiter in the GLD chart. But a negative outcome seems more likely, with possible rebound on Wednesday as the Moon enters Gemini and sets up a very nice grand trine with the transiting Jupiter and natal Venus. Thursday could well see more weakness. Gold is likely to stay weak until the first week of January when transiting Mars will conclude its aspect to the natal Moon at 24 Capricorn. After that, gold is likely to see some kind of recovery as Jupiter builds into a sextile aspect with the ascendant. Prices will likely get a boost or even peak around January 15 or 18. This rally is unlikely to make new highs but it looks quite substantial nonetheless. Weakness is likely to resume in February.
5- day outlook — bearish
30-day outlook — bearish-neutral
90-day outlook — bearish