

- Probable rally towards end of the week
- Dollar steady around 78; rise likely to begin next week
- Gold higher by Thursday with possible top over $1000
- Crude may rise above $70 on late week rally
- Probable rally towards end of the week
- Dollar steady around 78; rise likely to begin next week
- Gold higher by Thursday with possible top over $1000
- Crude may rise above $70 on late week rally
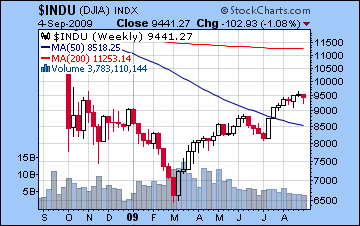
As if to underline the arrival of the historically bearish month of September, stocks moved modestly lower last week as uncertainty grew over the prospects of a sustained recovery. Despite the late week rally attempt, the Dow lost over 1% to close Friday at 9441 while the S&P finished at 1016. This outcome was more or less in line with the forecast as we finally saw some significant across the board selling on Tuesday to mark the tense Mercury-Mars aspect. Monday was down as expected on the Moon-Rahu conjunction, although since the decline was relatively minor, that increased the chances for Tuesday’s bigger pullback. Clearly, the Jupiter influence on the Mercury-Mars square only amplified the bearishness and was not sufficient to change the sentiment direction. And as I suggested in last week’s newsletter, Wednesday negative performance followed Tuesday’s decline as a possible manifestation of the extended influence of this complex Mercury-Mars-Jupiter alignment. Having three consecutive down days was heartening given my bearish outlook here and the previous inability for the market to acknowledge the stress inherent in the Mercury-Mars aspect. As predicted, the late week saw a nice bounce higher on the growing Venus influence on Friday’s Full Moon, although not enough to offset earlier losses.
Now that this rally has suffered a more of a meaningful pullback and the negative Mercury-Mars energy has manifested, are we going higher this week or is this the beginning of a larger move down as skepticism and doubt colour the thinking of a growing number of market participants? From a technical perspective, it seems increasingly difficult to support the bullish view. While last week’s selloff may have been a healthy correction, it does not alter some inconvenient facts. First, volume continues to show cracks as last week saw another weekly loss and moreover volume rose on the down days and fell on the up days. MACD remains negative, even if bearish histograms may be slightly shrinking. Note how the negative divergence we saw in the recent highs has been paralleled by the recent lows as last week’s higher low coincided with a lower low in MACD. Of course, until the 50 and 200 DMA stops climbing, we cannot say we are entering significant correction territory. But since the moving averages are very much lagging indicators, they likely would not turn lower until after a decline had already started. If the market makes another rally attempt this week as I expect it will, then the August highs will form a natural resistance level. Failure to exceed those highs (9600/1040) would provide the market with a technical reason for another round of selling, this time perhaps on a larger scale. This prospect of a deeper correction coincides nicely the approaching Sun-Saturn-Uranus alignment on September 17. Given the malefic nature of the planets involved and the closeness of the aspects (< 1 degree), there is good reason to think that we are on the verge of a significant correction.
This holiday-shortened week features several important astrological influences that ought to move the markets higher by Friday. On Labor Day (Sept 7), Mercury begins its retrograde cycle which will last until September 29. This is often a weakening influence on the market and often corresponds with investors re-evaluating their assumptions about the market. So this period is more likely to see traders having second thoughts about stocks and may be seen as a bearish influence. At the same time, malefic Mars is now moving away from Mercury, so there is reason to expect a possible improvement in sentiment in the near term. On Tuesday, the Moon is in sidereal Aries, a sign ruled by Mars. This is often a problematic influence so I would not expect a big up day here. Another possible bearish influence is that Saturn enters sidereal Virgo late on Tuesday. By itself, this may not be enough to move markets down just yet but it does signal an imminent shift in Saturn’s energy and that may highlight the awkward geometric contact with Uranus and Neptune. Wednesday and Thursday seem more conducive to gains as Venus and the Sun move into a minor aspect while both are resonant with Jupiter. It’s hard to say which day is more bullish, but at least one day should see a significant gain of 1-2%. If pressed, I would lean towards Thursday as being more positive. Friday is really the day to watch since the Sun and Venus aspect to Jupiter will be slightly separating by then. While we could see more of a sideways drift here, there is a real possibility of major pullback, and it maybe enough to wipe out the gains of the previous two days. So I think there’s a good chance we will see the market trade near 9600/1030 at some point this week but likely decline after that back to current levels or below.
 Next week (Sept 14-18) looms as a potentially large decline on the Sun conjunction with Saturn and opposition to Uranus. While I’m tempted to surrender to my ‘inner bear’ and call for a really big decline of 10% or more in a week, it’s not yet clear that we are looking at something that large. Certainly, a decline of that magnitude is more possible at this time than it has been in many months, but one doesn’t want to assume too much too soon. For now, I am expecting a retest of the 50 DMA (now at 975) and possibly the 940 level. The following week (Sept 21-25) also should be bearish overall, at least in the early going as Mercury replaces the Sun in the larger outer planet configuration. By that time, we could conceivably see a retest of the July lows of 8200/880. Even if we see a bounce after that, the market is almost certainly falling again as we enter October. The planetary alignment around October 7-10 also has the potential for a very large decline, possibly even larger than what we will see in mid-September. This looks very much like a lower low so that may be a good time for investors contemplating short covering or going long. Given the probable volatility we will see through October and November, it may be prudent to establish any new long positions gradually over a period of time.
5-day outlook — neutral
30-day outlook — bearish
90-day outlook — bearish
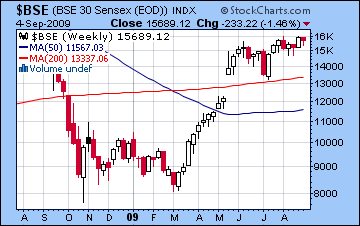
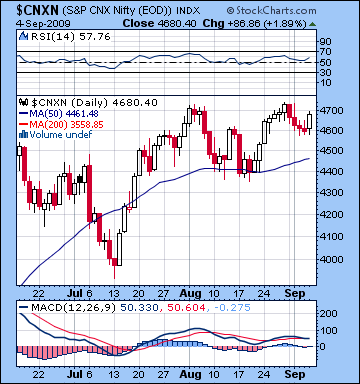 Continued monsoon worries and weak cues from global markets last week sent Mumbai modestly lower as indices trimmed almost 2% and registered declines on four out of five sessions. After trading below 4600 midweek, the Nifty recovered somewhat by Friday to close at 4680 while the Sensex finished at 15,689. This negative outcome was largely in keeping with last week’s forecast as the bearish energy from the Mercury-Mars aspect finally delivered its payload. We were also correct in expecting the early part of the week to be negative with gains coming later. Monday was down as forecast on the Mars affliction to the Moon and it turned out to be the worst day of the week. Not surprisingly, Tuesday was also bearish on the Moon-Rahu conjunction. I had wondered if Wednesday’s Moon-Jupiter conjunction might produce gains but any positive intraday sentiment did not hold by the close. Thursday also followed the forecast as the Moon’s entry into Aquarius saw caution prevail. Finally, Friday was indeed the most positive day of the week as we suspected it might be as markets saw a decent gain with the Moon activating the Sun-Venus aspect. Overall, the bearish result was representative of the negative planetary energy outlined last week, even if declines were less than 2% on any given day.
From a technical perspective, last week’s correction off the new Nifty highs was fairly predictable given the need of the market to consolidate before any other advances could be attempted. MACD is slightly negative here as the trigger line has merged with the longer moving average line and both are flat indicating uncertainty and the lack of any clear market direction. RSI is still moderately bullish at 57 and despite the profit taking last week the 50 DMA is still rising. My own bearish view notwithstanding, last week’s pullback to 4600 may still plausibly reflect a bullish opinion since 4600 matches the previous high. In that sense, it was nothing out of ordinary and does not indicate any imminent breakdown. Nonetheless, the bearish divergence in MACD between previous highs still looms as a weakness in any possible future rally attempt. Certainly, any rally attempt that fails to hold above 4700 will add to the bearish technical view. A failure to exceed 4730 will constitute a bearish triple top in the Nifty and may give encouragement to bears to aggressively short the market. I believe this is the most likely scenario in the coming weeks as I believe a significant correction is imminent. Assuming we see a major breakdown below 4400 in mid-September, possible downside targets are 3500 on the Nifty and 12,000 on the Sensex.
This week is likely to see the market trade higher although it is less clear if it will close higher. Monday begins with the Mercury retrograde cycle, a generally bearish influence. With Mercury moving backwards (from our vantage point here on Earth) from 7 to 29 September, investors may review or re-assess their positions and their willingness to take on risk. This penchant for having second thoughts is the main reason why retrograde Mercury cycles are often linked to declining or sideways markets. It is a time when traders are unwilling to push stocks higher into uncharted territory, preferring safety and cash. While Monday sees the start of Mercury’s retrogradation, Monday itself may not be overly negative since the negative influence of Mars is now diminishing. The Moon is in Jupiter’s sign of Pisces so there is a good case to be made for gains, especially in the morning as the Moon aspects Venus. Tuesday and Wednesday the Moon is in Aries and this may prove to be more difficult for the market as it may promote tentativeness that resists holding long positions. As an additional negative factor, Saturn enters Virgo on Wednesday where it will remain for the next two and half years. This needn’t have an immediate negative influence on stocks, however, but rather represents a kind of low frequency shift in Saturn’s energy. It is unlikely that both days will see declines, however, as the negative energy looks fairly limited. I would lean towards Tuesday as the worse day, but really either day could be down. By contrast, Thursday and Friday look much more bullish, so we should see a net gain from those two days, and very possibly two up days. While the end of the week looks positive overall, watch for some selling late Friday towards the close as the Venus-Jupiter culminates. This has the potential to seriously mitigate earlier gains. Depending on how low we go midweek, there is a chance the market can finish higher for the week although probably not higher than 4730.
 Next week ( Sept 14-18) is critically important for setting the stage for the major pullback we are expecting. A very negative alignment of the Sun, Saturn, Uranus and Neptune will occur and this has the potential to take the market down hard. It is very possible that the market will retest the 4400 level at that time. This kind of alignment of malefic planets has not occurred for many months and therefore introduces the real possibility of a sharp decline on the order of 10% over a couple of days. The following week (Sept 21-25) will likely also be bearish as Mercury will take the place of the Sun in that alignment and we will likely see lower lows established, perhaps around 4200-4300. With some kind of bounce likely after that perhaps back towards 4400, the market will be poised to go down further as we enter October. The Saturn-Rahu aspect occurs at that time and this also has the potential to move markets sharply into the red very quickly. We may conservatively expect to see 4000 tested at that time, with 3500 as a kind of worse case scenario. Of course, given the unusually negative character of these upcoming aspects, it’s conceivable we go move lower than that. However, it is important not to establish unrealistic expectations. We will be able to get a better idea of the contours of this upcoming correction once we see the outcome of the Sun-Saturn-Uranus alignment on 17 September.
5-day outlook — neutral
30-day outlook — bearish
90-day outlook — bearish
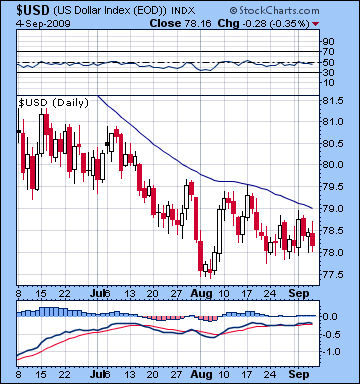 After an encouraging start to the week that saw the dollar trade at 79, the sellers returned and the dollar closed slightly lower on the week a little above 78. This was more negative than forecast as I thought we could see it trade above 79 at some point in the proceedings. Monday’s gain came more or less as predicted as the Venus sextile to the Midheaven in the USDX chart created a bullish mood for the greenback. Once that was out of the way, however, the Mercury-Mars square did few favours as the positive effect of near-stationary Mercury sitting on the natal Midheaven was offset by the Mars square. While I acknowledged the difficulty in calling this influence, the lacklustre outcome was still disappointing. The dollar remains below its 50 DMA and that average is still in full decline. MACD is mostly neutral here and apparently seeking direction while RSI is still treading water hovering close to 50. We may note that since the August lows below 78, all subsequent lows have seen buyers move in at progressively higher prices, suggesting a growing enthusiasm for the dollar. In fact, we can see it is currently in a small pennant formation that is often characterized by a big break out in either direction. Given my bullish outlook, that should be to the upside. It is important to remember that pennants/triangle patterns are often marked by false break outs in the opposite direction of their eventual trend. Given that the dollar may see selling this week, I would not be surprised to see trades outside of this pennant perhaps between 77.5-78 before it moves higher next week.
This week could again begin favourably for the dollar as Venus trines the natal ascendant on Tuesday. This may push it up towards 79 once again, and maybe higher. But as Mars moves under the influence of natal Ketu midweek, look for significant selling, possibly below 78. The real puzzle this week concerns Friday. With Mars moving out of range of Ketu, there may be some room for upward movement. However, there is no powerfully positive aspect here that would fuel a decent gain that might offset the probable losses of the previous days. Friday’s relatively fast moving Moon-Jupiter aspect to the natal ascendant is definitely bullish, but I’m less confident it can generate big gains. Depending on how low we go by Thursday, Friday may only be able to cut those losses in half. Assuming Tuesday’s gain is on the order of one cent, the dollar may finish the week close to 78, or even a little below. Next week is the far more bullish week for the dollar as Jupiter’s aspect to the ascendant tightens. The dollar seems likely to trade above its 50 DMA at that time and will finally begin to test its key levels of resistance at 80 and 81.5.
The Euro rose slightly last week as it again approached a key resistance level closing at 1.43. This outcome was more or less in keeping with expectations since Monday’s decline coincided with the Moon-Rahu aspect in the natal chart. Also, we did see a significant rebound by Friday as I forecast in last week’s newsletter on the transiting Venus activation of the natal Sun-Uranus aspect. This week seems quite mixed with weakness on Tuesday as the Moon transits Aries in the Euro 8th house. Gains are more likely Wednesday (especially at the close) and Thursday as the Venus-Jupiter aspect will likely increase risk appetite. Friday may see profit taking as transiting Mars opposes the natal Sun. We still could see the Euro finish above 1.43 this week, although perhaps not by much. As expected, the Rupee traded at 49 last week and weakened slightly overall closing at 48.8. It should hold fairly close to these levels this week, although it may well trade above 49 in the early going and rally to 48.5 by Thursday or early Friday.
Dollar
5-day outlook — neutral
30-day outlook — bullish
90-day outlook — bullish
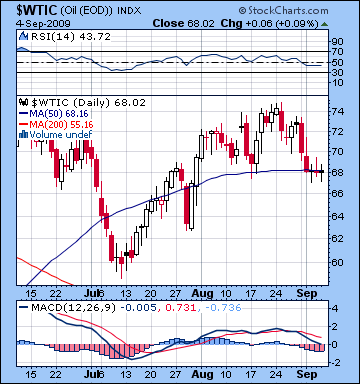 As predicted, crude fell below $70 last week and closed just under $68 on the continuous contract. I had expected it to test its 50 DMA at $68 and that proved to be a significant level of support as it fell to $68 by Tuesday and closed very near that level for the rest of the week. Last week’s forecast was correct in suggesting early week declines on the Mercury-Mars square as Monday saw a big loss to $70. The bearishness continued into Tuesday as the Mercury-Mars activated the natal nodes in the ETF chart. Wednesday’s recovery never really took off, however, as the Moon-Jupiter conjunction only managed to keep crude holding steady at $68. Even more puzzling was the inability for the late week Venus aspect to the natal Sun-Uranus pattern to push crude above $70. Despite some intraday rally attempts above $69 both days, sellers returned by the close. The failure for crude to rally back above $70 on this bullish aspect is an important sign that support for crude may be quickly ending. Since it was speculative darling during the spring and summer hope rally, it may have further to fall this autumn. Crude is in an increasingly vulnerable technical situation as MACD is quite negative with falling averages RSI has moved below 50 into bearish territory while the 50 DMA is still flat although it offered some support in last week.
This week could see a breach of the 50 DMA on Tuesday but we should see a powerful one or two day rally on Wednesday and Thursday and perhaps extending into early Friday. On Monday, the Moon enters Aries which corresponds to the 12th house in the Futures chart. This is a nominal bearish influence which may produce a modest decline. The late week Venus-Jupiter aspect has the potential to push prices up significantly, probably back to $70-72. I would not rule out an even higher close than that by Thursday but we’ll have to see what kind of decline the Aries Moon generates. Friday could see profit taking as crude will fail to match previous highs thus encouraging bears. With the difficult planetary alignments over next week and the following week, crude could be retesting its July lows of $60 by September 23. By October 7, crude may well be trading below $50.
5-day outlook — neutral-bullish
30-day outlook — bearish
90-day outlook — bearish
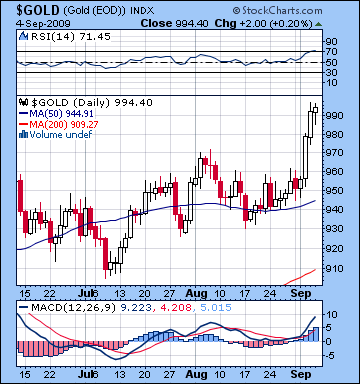 With the growing uneasiness about the sustainability of the equity rally, more investors chose to hedge with gold last week sending the price much higher as it closed at $994. Following Monday’s expected weakness, the size of this bullish move was surprising as gold punched through its current trading range on Wednesday and never looked back. Clearly, the current rally in gold is connected to the approaching Jupiter conjunction with the natal Moon in the ETF chart. While I had anticipated support for prices with this aspect, I did not forecast this kind of gain. At the same time, I did suggest that the rally in gold would likely last until the Venus-Jupiter aspect is exact on September 10-11. From a technical perspective, gold’s break above the pennant pattern has emboldened bulls to pile on and take prices higher. The possibility of this move being a fake break out remains, although the longer it goes, the more convincing the rally becomes at least in technical terms. MACD is now positive and moving higher while RSI is risen over 70.
This week gold is very likely to rise higher, perhaps even approaching its all-time high of $1020 on the strength of the Sun-Venus-Jupiter alignment. With Monday closed for Labor Day, Tuesday may see some weakness as the Aries Moon conjoins Rahu in the ETF chart. While I don’t think this will coincide with a big decline, it may fall back to $980-990. That would set the stage for Wednesday and Thursday to move gold above $1000. Thursday looks to be the most bullish day. Friday has an increased chance of a pullback as the transiting Mars will aspect the natal Jupiter. There is a good chance that the highs we see towards the end of the week will the be highs for the year in gold. The crucial test will come the following week and the Sun-Saturn conjunction on September 17-18. Since Sun is the planetary significator of gold, this conjunction with pessimistic Saturn ought to send gold lower, perhaps by quite a bit. The end of September and October remain the most astrologically challenging period for gold for two reasons. First, transiting Saturn will aspect the natal Sun in the ETF chart in late September and then Ketu will conjoin natal Saturn in early October. This is a powerful double affliction to key points in the gold ETF chart and has the potential to take prices down significantly. At the same time, the presence of the Jupiter station (23 Capricorn) in close proximity to the natal Moon (24 Capricorn) may offer a modicum of support to gold and prevent a total collapse. Nonetheless, it seems that we will see a major retracement below $900.
5-day outlook — bullish
30-day outlook — bearish
90-day outlook — bearish