

- Stocks lower early but will rally towards last week’s highs; Jupiter-Neptune rally is largely over
- Dollar prone to weakness
- Gold to bounce higher after early selling
- Crude will recover and approach $72
- Stocks lower early but will rally towards last week’s highs; Jupiter-Neptune rally is largely over
- Dollar prone to weakness
- Gold to bounce higher after early selling
- Crude will recover and approach $72
Last week’s rise was a significant retest of the November 2008 highs of 1010 on the S&P. This is an important resistance level for the market as many traders will see any closes above that level as a signal of a break-out on the upside and a continuation of the rally. As I noted last week, however, I’m skeptical that the market can go much higher here as the number of malefic planetary aspects will tend to increase going forward. So that close at 1010 should be seen as a potentially bearish indicator since the market may not be able to rise much above it without sellers overwhelming buyers. At the same time, it should be noted that the Dow (9370) remains below its November highs (9600) so any failure to confirm those highs would be another sign of weakness. MACD remains positive but there are clear signs of topping as the moving averages flatten out. The Relative Strength Index (74) is also indicative of a possible top as it has stayed over the 70 level for a second week. Volume is still relatively flat and suggests that this is nothing but a bear market rally. And not to split hairs, but if one looks closely at last week’s action, the highest trading days were down days while the big up days had slightly smaller volumes. So there are good technical reasons for expecting a reversal in the very near future. I would not rule out a higher high in the next week (or two), but it is unlikely to exceed current levels by much. I would say there’s a 50-50 chance that we’ve seen the top already (on Friday), but with the probability for a couple more up days next week, we don’t want to rule out the possibility of a somewhat higher close, say, in the range of 1020/9500 by the end of this week.
This week could see some sizable moves in both directions as there will be two significant aspects for the market to digest. Early in the week, the key aspect is the Mars-Saturn square that is exact on Monday. The energy from these two malefic planets is often negative and the square aspect increases the likelihood for a significant down day, mostly likely on Monday. While I do feel the most probable scenario is a large pullback (2-4%), it is important to note that some of the negative energy may be mitigated by the Moon’s transit of Pisces at that time. The afternoon, therefore, may see some recovery, although the market will likely stay well in the red. The Moon begins Tuesday in Pisces but by afternoon it will enter Aries. This could indicate a split day where sentiment will shift halfway through the day. So if Tuesday begins negative, the market may turn around by early afternoon. The opposite may also true, although I think closing weakness is a less likely scenario. Generally the energy this week should shift from negative to positive as there is a multi-planet alignment forming with Sun-Mars-Jupiter by Thursday and Friday. Wednesday onwards therefore has the potential for gains, although I would think the best chance for gains is Thursday when the Sun is closely aspecting Jupiter and optimism and confidence are on the rise. Wednesday is difficult to call although a down day is possible there as Mercury forms a minor, but exact, aspect with Rahu. If Wednesday is down, then that increases the likelihood for a bounce Thursday and perhaps into Friday. Friday runs the risk of a post-alignment selloff, however, as Mars moves past Jupiter and Mercury is moving dangerously close to Saturn — less than three degrees. Overall, I think there is a 50-50 chance here that we could trade above last week’s high (SPX 1010). Much depends on what kind of pullback we see Monday and into Tuesday. If it’s more than 4%, then obviously that will make it less likely that the market can rebound that far. If for some reason there is no major pullback Monday, then it’s possible we go above 1020 by Thursday. Nonetheless, I do think some kind of decline is the most probable scenario for early in the week.
Next week (Aug 17-21) looks quite negative as we will see an even more important multi-planet alignment early in the week. Mercury conjoins with Saturn (bearish) which will be in close quincunx aspect with Jupiter (also bearish) while Sun, Mars, Uranus and Neptune all sit at 1 degree of their respective signs. It’s a very powerful double alignment that could not only mark the turning point for the market but also take it down substantially, perhaps more than 5% over a couple of days. Some gains are likely by the end of that week as Mercury and Venus will aspect both Uranus and Neptune. Both of these moves have the potential to be very large, so investors can expect a real roller-coaster from here on in. The following week ( Aug 24-28) looks more mixed with big declines early in the week on the Mercury-Mars square but gains more likely midweek and after on the Venus-Ketu conjunction. In fact, this could prove to be an up week overall. As we move into September, we should see another big move down, especially around Labour Day, when Mercury goes retrograde while squaring Mars. This is massively negative indication and given the simultaneous Saturn-Uranus opposition, we could see stocks fall 10% within a week. Although we will see powerful rallies (e.g. Sep 9-11), September looks quite bearish overall and we will likely see the July lows knocked out (8200/880) by then. Just where the bottom will be in this retracement remains an open question. Although I am very bearish here, it is possible we may only go down to 7400/800 — somewhere above the March lows but below the July lows. However, the planets are sufficiently negative in September, October and even November that we should also be open to the possibility that March lows could be retested. Jupiter once again turns direct on October 13, so that could be an important date to remember in terms of a potential bottom, or at least a possible end to this imminent leg down.
5-day outlook — neutral – bullish
30-day outlook — bearish
90-day outlook –bearish
1-year outlook — bearish
Stocks in Mumbai fell 4% last week as anxieties over the monsoon combined with relative Asian weakness. After moving higher earlier, markets fell the rest of the week as the Nifty closed at 4481 and the Sensex at 15,160. I had expected more upside on the strength of the Mercury-Venus aspect, particularly late in the week, but it so happened that the aspect fell too close to the natal Saturn in the NSE chart and hence most of the positive potential was drained away. Monday was better than expected, although the gains arrived later in the day and continued into Tuesday where I had been more bullish. Wednesday was harder to predict and indeed it turned out to be largely flat. I had been fairly bullish about Thursday and the Moon-Jupiter aspect and while the market drifted higher by the afternoon, it abruptly sold off once European markets opened. Friday was down sharply and that was not out of line with my sense that the Moon in Aquarius may bring caution into the market. So I was correct in believing that we would trade above the previous week’s levels at some point. Also my sense of uncertainty about whether we would close higher was well founded as courage evaporated after Thursday’s final retest of the 4700 level.
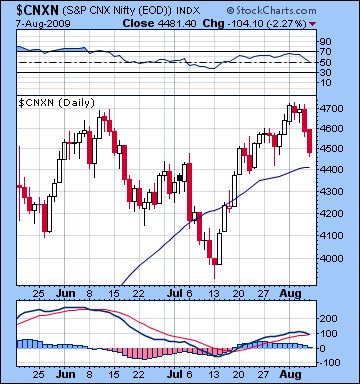 After trading above 4700 on four different days this week, the Nifty retreated every time. Clearly, this is emerging as a powerful point of resistance and matches the June highs quite closely. The failure of the market to break above this level should be seen as a bearish sign. MACD appears to be turning negative both in terms of histograms and an imminent crossover. In addition, the 50-day moving average is on the verge of flattening out and should the market fall below its level (4400) then that would be another technical indicator that the rally is over and the next leg down has begun. Even with a major bounce later this week, I believe it is unlikely that the market will break above its June highs. So our next primary area of concern lies in assessing where support will lie. There is a fair amount of support around 3950-4000 so we will have to assign the most probable time frame (see below) when that level will be tested and breached.
This week features two very different influences. On Monday and perhaps into Tuesday, Mars will square Saturn. This is a clearly negative influence that will exert more downward pressure on stocks. At the same time, it is important to note that some of this negative energy has likely already been manifested by last week’s decline. So while more downside is likely early on this week, it may be relatively small. Wednesday and Thursday will also see some bearish action as the Sun forms a minor but exact aspect with Saturn. Some kind of significant gain is likely Thursday or more likely Friday, as Sun, Mars and Jupiter form a powerful alignment which also happens to activate the ascendant of the NSE chart. We should see at least one daily gain of 2-4% this week, possibly occurring on Thursday or Friday. Overall, I think the market can advance higher towards last week’s highs here if Monday isn’t down very much. If we see a big move down early in the week, however, then it may not be able to climb all the way back to 4500.
Next week (Aug 17-21) we see more volatility in both directions with a greater possibility of a decisive move down as two multi-planet alignments occur more or less simultaneously. As Mercury conjoins Saturn it will move into a tense aspect with Jupiter early on that week (Aug 17-18). This is a very bearish influence that could break any current support and take the market down to the next level. At the same time, however, the Sun, Mars, Uranus and Neptune will all sit in the first degree of their respective signs and this is likely to provide more astral fuel. It may both increase the size of the move down and also mark a clearer break with the Jupiter-Neptune based rally that began way back in March. The following week (Aug 24-28) looks more mixed with declines earlier on the Mercury-Mars square but with some recovery midweek and after with the Venus-Ketu conjunction. September seems likely to bring steeper declines as Mercury begins its next retrograde cycle (September 7) in a tight square with Mars. This is a very negative alignment and since it occurs around the same time as the difficult Saturn-Uranus opposition, the markets will accelerate their move down. September will likely see the market return to its pre-election levels (sub-3600). By October, we could see the Nifty trading below 3150 again. Admittedly, these levels are little more than guesses but they do reflect the severity of some of the planetary influences in the coming two months. If this week and next are more towards the ‘worse case scenario’ and the market falls below 4000, then that would increase the chances that we could retest the March lows (2525) in October. October is a possible bottom in this down leg as Jupiter (23 Capricorn) will reverse its direction on 13 October and begin to move forward again towards the hopefulness of Neptune. That said, November still contains a number of very challenging aspects and its conceivable that stocks will fare poorly until December. I will study the late Fall situation in closer detail in future newsletters.
5-day outlook — neutral
30-day outlook — bearish
90-day outlook — bearish
1-year outlook — bearish-neutral
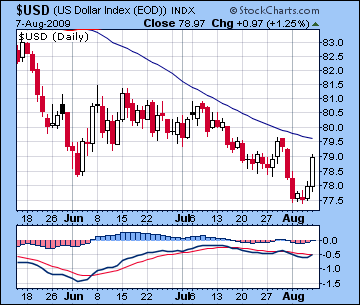 With news that the ECB would keep rates low, the dollar rallied late last week and closed higher, just a shade under 79. As expected, the dollar dipped into no-man’s land early in the week as it breached its June lows and traded below 78. This coincided nicely with Mars’ nasty aspect to the ascendant in the USDX chart. Tuesday and Wednesday saw relatively little movement, although the low held which was a heartening sign for the dollar. While I missed Thursday’s modest move higher, Friday’s huge rally was well reflected (and anticipated) by the Sun’s aspect to the ascendant. The technical situation remains in flux as MACD shows signs of a bullish crossover although the dollar remains below its 50-day moving average (79.5). Depending on how one chooses to interpret it, last Monday was a bullish confirmation of the June low and the formation of a double bottom or it was a bearish breach of that previous low. Given my bullish outlook for the dollar, I lean towards the double bottom scenario since it was close enough. As an additional bullish indicator, Friday’s rally occurred on an up day for stocks, a very rare occurrence since the start of this bear market. This would tend to indicate a growing appetite for the dollar regardless of its safe haven status. Alternatively, Friday’s move to the dollar foreshadows the coming decline in stocks.
This week looks like a mixed bag as Monday’s Mars-Saturn aspect may see gains as Mercury and Venus will be in aspect with natal Jupiter (17 Virgo). The Moon in Pisces will offer a helping hand, especially in the morning. Tuesday and Wednesday may be flat overall as there are no clear aspects in play. We could see a big move up Thursday or Friday as Mercury sits on the 10th house cusp. I would lean towards Thursday as the up day. My thinking now is that last week’s lows should hold here although I’m less certain about a big move higher until September. The Sun entering Leo around Aug 17 will be an important test as it may provide a boost to the dollar’s status and visibility since the Sun is the 10th house lord of status in the natal chart. An additional bullish factor will be Mercury entering Virgo Aug 20. This will create the very fortuitous astrological situation of the 11th lord of gains transiting its own house. I’m not sure how immediate the effects of these sign ingresses may be, but they certainly bode well for the coming weeks. As an added level of confidence to the September dollar rally and corresponding stock decline, Mercury will station exactly on its Midheaven on September 7. It is a very powerful influence in the dollar chart that all but guarantees a major rise around that time.
The Euro retreated last week on bearish rate comments by the ECB and closed below 1.42. As expected, however, it did trade above 1.43 for a time before heading lower by the end of the week. I thought it might hold its own a little better since the Mercury-Venus formed a minor aspect with the natal Jupiter. This week the Euro may tend to move lower on the Mars-Saturn aspect with only intermittent relief later on. The Sun-Mars-Jupiter aspect on Friday sets up nicely on the Mercury-Jupiter square in the natal chart so that could send it substantially higher. The Euro is likely to make a big move on Monday Aug 17 as Mercury conjoins Saturn opposite the natal Jupiter. It should be a decline although it is conceivable that it could go higher. Meanwhile, the Indian Rupee was mostly unchanged last week. The Rupee may stay near these levels this week but it is increasingly at risk for declines as August turns into September. 50 is very likely by September.
Dollar
5-day outlook — neutral
30-day outlook — bullish
90-day outlook — bullish
1-year outlook — bullish
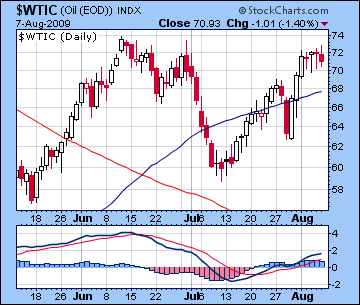 After a big rise Monday, crude oil finished just below $71 and ended the week higher. This outcome was largely in keeping with expectations as Monday’s Sun trine to natal Jupiter in the Futures delivered the gain right on schedule. Tuesday saw a little profit taking as forecast but Wednesday and Thursday were fairly flat and did not show any further rise. I had wondered if we might see selling Friday ahead of the Mars-Saturn square and that is exactly what happened as crude fell 2%. Technically crude remains in a strong position as MACD is positive and the 50-day moving average is still rising. Perhaps more important, however, is that crude may be in the process of forming a very bearish double top formation since it has so far been unable to exceed its June highs. If it fails to do so next week, then it would be ripe for a major decline.
This week is likely to see a large pullback early on as Mars squares Saturn close to the natal ascendant. Monday has the potential to send crude back under $70 and then some, although with the Moon transiting Pisces, it may remove some of the sting of the available malefic energies. If for some reason Monday isn’t down, then Tuesday may well be as the Moon moves into Aries. Look for a nice rally as the week progresses with Thursday and Friday offering the possibility of taking crude back to $72. Crude seems doomed to fall back to $50 by September as Saturn will square the ascendant. By mid-October, I expect crude to be around $40-45.
5-day outlook — neutral-bullish
30-day outlook — bearish
90-day outlook — bearish
1-year outlook –bearish-neutral
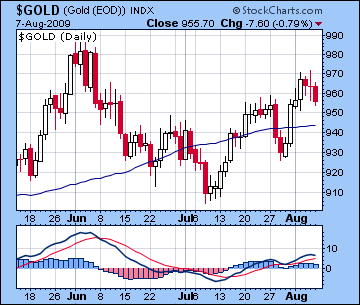 After trading near $970 early in the week, gold slipped back to close mostly unchanged at $955. This was very much in keeping with my forecast as Monday and Tuesday both featured positive aspects involving Venus and Jupiter. The rally ran out of gas a little prematurely, however, as Thursday was flat. I thought it might have climbed up as high as $980, but Thursday’s intraday trading peaked at $972. And Friday’s Mars-Mercury aspect did in fact spur a sell off as I thought it might. MACD remains in positive crossover mode, albeit with some leveling. The 50-day moving average continues to rise and gold is trading above that level ($943). However, the failure for gold to match its June highs of $980 is definitely a bearish indicator. We can see a narrowing triangle pattern in the chart that connects progressively lower highs through 2009 amidst correspondingly higher lows. This pattern is usually resolved by a sharp break in either direction. In the present circumstance, this is very likely to be down.
This week could see gold take another run higher, perhaps to $960-970 intraweek. The Mars-Saturn aspect has the power to take gold lower on Monday or Tuesday, although I think will only occur for one day. As the Sun builds into its aspect with Jupiter by Thursday and Friday, we should see gold rise smartly. It may be more susceptible to declines after that. One day in particular that stands out as extremely negative is Monday August 24 (possibly the 25th) when Mercury squares Mars and sets up on the natal ascendant. I would not be surprised to see gold fall 2-4% on that day. And as Ketu slides over the natal Saturn in September, the selling will pick up momentum. As a possible low (albeit interim), we can look ahead to Friday October 9 when Mars (2 Cancer) conjoins Ketu (2 Cancer) very close to the natal Saturn (3 Cancer) in the ETF chart. Ironically, this will be a year to the day of the most dramatic decline in the 2008 meltdown. This is likely to be another very bearish day for gold — and most likely stocks also. There is likely a fair bit of technical support at the $650-700 level although it’s unclear to me if we will get down there that fast. We might.
5-day outlook — neutral
30-day outlook — bearish
90-day outlook — bearish
1-year outlook — bearish