

 (25 May 2025) Stocks retreated last week as the latest round of tariff threats by President Trump caught the market off-guard. While the rebound since the April lows has been impressive, there is some concern that Trump’s threat of a 50% tariff on the EU could undermine the rally and take stocks lower once again. And with 30-year Treasury yields now topping the psychological threshold of 5% given the ballooning US government deficit, financial markets are bracing for more turbulence for the rest of 2025. Whether a recession ultimately arrives or not, the global economic outlook is uncertain at best.
The current planetary influences offer only limited insight on the markets. I thought we might have seen a bit more optimism last week on the approaching 30-degree bullish alignment of Jupiter-Uranus, although that still has another week to go before it becomes exact on June 1. While evidence suggests it is a positive influence on sentiment, it may not be decisive for market direction. Perhaps last week’s pullback was more directly the result of Saturn’s ingress into tropical Aries on May 23-24. As I noted previously, previous Saturn sign changes are generally positive across a longer window of 20 or 40 days. But a study of 48 previous such ingresses showed that the 2 days immediately before and after the ingress are a bit bearish.
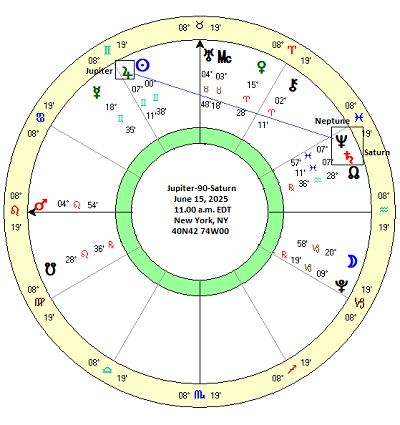
Jupiter-90-Saturn on June 15, 2025
With US markets due to open again on Tuesday, May 27, the worst of that Saturn influence will have passed. So what’s next? We could still see some bullish effects of the Jupiter-30-Uranus alignment in the coming days but there is also the approaching Jupiter-Saturn square to consider. Jupiter will form its third and final 90-degree alignment in this series with Saturn on June 15, 2025. Due to the retrograde cycles of both planets, Jupiter and Saturn often form square alignments in clusters of three across a period of several months. Jupiter and Saturn formed their first square in this series in August 2024 when Jupiter was direct and Saturn was retrograde. The second square occurred in December 2024 when Jupiter was retrograde and Saturn was direct. Next month, both planets will be in direct motion as they will align for the third and final time in the current series. Jupiter-Saturn squares occur every 8 or 9 years with the next series due in 2035.
Jupiter and Saturn actually form two distinct types of square alignments during its 20-year synodic cycle. The first occurs when there is a 90-degree angular separation of Jupiter from Saturn. As the faster-moving body, Jupiter initially moves 90 degrees away from Saturn and thus forms a square in which it is four whole signs away from Saturn. The current Jupiter-Saturn series of squares in 2024-2025 is this category of a 90-degree ‘forward’ counterclockwise square. The next square occurs when Jupiter has moved 270 degrees away and 10 whole signs away from Saturn according to standard counterclockwise reckoning. This 270 degree (or 90 degree ‘backwards’ square) alignment is seen as significant by Vedic aspecting rules since Saturn is said to cast its full-strength tenth house aspect upon Jupiter. While verifying Vedic aspecting rules is not our main concern here, it may be worthwhile to take note of any differences in results between these two types of square aspects.
Hypothesis
All aspects involving Saturn carry a certain negative overtone. These may not be borne out in practice, but as a natural malefic, Saturn’s bearish reputation means that all of its alignments are treated with a measure of skepticism. From my study of Saturn ingresses, however, there was no clear evidence to suggest that this was negative for the stock market, aside from the immediate 4-day window that straddled the exact sign change. So it pays to keep an open mind about all things, including Saturn. However, the square aspect itself has a lot of bad press in Western astrology, even when involving benefics. A Jupiter-Saturn square would seem to be a blueprint for trouble, at least on paper. Unfortunately, there isn’t much in the way of research on its market effects. But based on the astrological theory, I would think the Jupiter-Saturn square would be somewhat bearish, especially very close to the time of the exact 90 degree alignment.
Results
Using the Trading View database (1896-2025) for the Dow Jones Industrials (DJIA), I compiled a sample of 33 cases when Jupiter and Saturn formed a 90-degree square. I chose a series of time intervals before and after the date of the exact square that would illustrate any relative proximal effects. The first interval recorded the price 30 days before the exact alignment, the second interval was 10 days before, then 5 days before, and then the exact date. This pattern was repeated for the intervals after the exact alignment. At their normal speeds, the 30 day interval corresponds to about a 5 degree orb between Jupiter and Saturn, which is an orb used in common practice. Perhaps longer intervals such as 60 days could have yielded additional information but that will have to wait for another study. The first table shows the closing prices for each interval for the 33 cases. I also included whether the case was the first, second or third square in the series (column 2, “Series”). The third column recorded the angle of the case whether it was a 90 degree fourth sign forward square or a 270 degree, 10th sign forward square (i.e. a 90 degree backward square) and which planet, if any, was retrograde.
The results were quite surprising. Not only was the Jupiter-Saturn square not bearish as expected, but in some ways it was actually slightly bullish. The first column (“-30d 30d”) shows the percentage change in the DJIA across a 60-day window that straddles the exact date of the 90-degree alignment. Based on the assumption of a 7.2% average annual return, the expected value for any 60-day window should be a gain of 1.2%. The average here was very close to that at 1.24% and suggested no effect at all, bullish or bearish. While the median was somewhat higher at 2.04% and 64% of cases were positive, this result is well within expected range. In statistical parlance and without any consideration of significance and limited sample size, this result does not refute the null hypothesis, i.e. this alignment is neutral and has no effect on market outcomes.
The 30 days leading up to the exact square were a bit more positive than the 30 day interval that followed the square. The 30-day interval for the applying square (2nd column, “-30d 0d”) had an average gain of 0.82% compared with just 0.32% for the 30 days after the square (3rd column, “0d +30d”). It is not a huge difference but it is noteworthy that the 30-day leading up to the exact square is greater than the expected value while the 30 days following the exact square is less than the expected value. This before and after difference will become more important below.
Other time intervals showed broadly similar results, although the same pattern was exhibited in shorter intervals. Thus, the results for the 10 days leading up the square (“-10d 0d”) were more positive (0.55%) than the 10 days following the square (“0d 10d”) which produced an almost flat result (0.04%). The same pattern of bullish before the square and bearish after the square was seen in the shortest time interval in the last two columns (“-5d 0d, 0d 5d”). The 5 days leading up to the exact square alignment showed a 0.69% average gain while the 5 days after the square alignment showed an average loss of -0.23%. Neither outcome is particularly large, but the pattern persisted across most intervals.
First disaggregation: 90 and 270 degree batches
But what happens if we separate the data into two batches of 90 degree squares and 270 degree squares? It turns out that the 90 degree square is somewhat more bullish than the 270 degree square. Looking at the table for the 90-degree/4th house alignments, we can see the 60-day window represented by the first column (“-30d 30d”) shows an average gain of 3.01% and a median gain of 2.50%, well above the expected value of 1.20%. That is much more bullish than the aggregated data discussed above. Both 30-day intervals before and after the exact alignment were also bullish. The 30 days leading up to the 90-degree square posted a 1.58% gain which was more than twice the expected value of 0.60%. The 30 days after the square was almost as positive at 1.38% and both intervals had 63% of their cases produce positive results. However, the before and after effect was still in evidence for the shorter intervals of 10 days and 5 days. The interval five days before the square (“-5d 0d”) had a gain of 0.66% which was six times the expected value of 0.10% while the last column (“0d 5d”) was totally flat with just an average gain of 0.01%. These results for the 90 degree/4th sign square may be more relevant to the current situation since we are approaching a forward 90 degree square on June 15, 2025.
The results of 270 degree/10th house square batch were less positive. The 60-day interval displayed in the 1st column (“-30d 30d”) was actually negative (-0.41%) although this was obviously skewed by the brutal 27% decline in the 1896 case. The median may be a more representative number and it is still quite bullish at 1.89%, although it is less than the comparable figure for the 90 degree square at 2.50%. But the other intervals are nonetheless less bullish in this batch as the percentage of positive cases is consistently lower than the 90 degree batch and the medians are sometimes actually negative as in the case of the 3rd column (“0d 30d”) which posted an average results of -0.77%. And the same pattern showed up here with the interval after the exact square being less positive than the equal time interval before the exact square. The 5 days leading up to the 270 degree square (“-5d 0d”) had an average gain of 0.71% while the 5 days following the alignment showed an average loss of -0.45% (“0d 5d”). Interestingly, these more negative results provide some evidence to support the Vedic notion that the 270 degree/10th sign square alignment between Jupiter and Saturn as being more bearish than the 90 degree square alignment due to Saturn’s full-strength 10th house aspect. The difference isn’t huge, but it is intriguing that it exists at all. It is definitely worthy of further study.
Second disaggregation: the 3rd series square only
Another possible disaggregation would be to examine different qualities of Jupiter and Saturn at the time of the 90-degree alignment. Since the upcoming Jupiter-Saturn square on June 15 is going to be the third and final square in the current series, it seemed logical to see if there were some common characteristics of previous 3rd series square alignments. In most cases, the 3rd series of squares occurs when both Jupiter and Saturn are in forward motion, with the 1st and 2nd series of squares having one or the other in retrograde motion. In order to increase the number of cases in the batch to a more viable size, it was necessary to combine both the 90 and 270 degree squares. This still only yielded a tiny sample of 9 cases.
The data suggest that this 3rd series square is bullish with averages and medians both above expected values. As with the other batches, there was a clear deterioration of bullish effects in the time following the exact square. This is clearly seen in the 3rd column (“0d 30d”) with an almost flat average of 0.08% and a negative median of -0.87%. The 30 days prior to the square was significantly more bullish. This effect was even stronger in the shorter time intervals with the 10-day window before the square (“-10d 0d”) posting an average gain of 1.22%, which is six times the expected value. For the 10-day interval straddling the exact square (“-5d 5d’), the average gain was 1.31% with all cases being positive. The 5-day interval before the square (“-5d 0d”) was 1.56% — fully 15 times more bullish than the expected value.
Conclusions
Despite Saturn’s malefic status, this study suggests that the Jupiter-Saturn square may actually be somewhat bullish in its market effects. This was a genuinely surprising outcome as I thought we might have seen negative returns from this aspect. Whatever bullish effects there may be, it is important to note that any effect is quite small and is not a solid basis for a trading strategy. The modest sample size of just 33 cases is another reason to take any conclusions here with a truckload of salt.
We may be on firmer territory in noting the contrast in the before and after periods surrounding the 90 degree alignment. The results show a consistently more bullish effect in the periods leading up to the square alignment in comparison with the periods that follow it. While consistent, the difference in the before and after effects is still quite modest and cannot be assumed in any future case. That limits its practical usefulness in terms of market forecasting.
Nonetheless, the benefit of these small studies is that they provide some evidence for underlying planetary bias that can effect market outcomes. In that respect they may resemble seasonality in which every month and every day has an inherently bullish or bearish bias based on previous long term data. Few investors would rely solely on seasonality bias to make investment decisions, but it can still provide relevant information that can be part of a larger analytical process.
Implications for upcoming square on June 15, 2025
While the rally in stocks has been showing signs of weakening over the past week, the approach of the Jupiter-Saturn square in June suggests that stocks could well stage a recovery — or at least create a floor under the market that would prevent a larger decline. On the basis of the above analysis, there is a path for stocks to move higher on the strength of the Jupiter-Saturn square, especially up until June 15. After that date, the outlook becomes less favorable as the after effects of the Jupiter-Saturn square tend to less bullish. While the bullish effects of the approaching square may be positive leading up to June 15, it is still entirely possible that stocks could instead move lower due to the effects of other planetary alignments.
On that score, the elephant in the room is Saturn’s conjunction with Neptune in June and July. Neptune will come to within one degree of conjoining Saturn at the time that Saturn will be squaring Jupiter. The resulting Jupiter-Saturn-Neptune double square alignment could exert some influence on market outcomes. This is a very rare three-planet alignment. So rare, in fact, that it has never occurred in the 120-year period that is included in the DJIA database. Therefore, it is unclear just what the effect of this Jupiter-Saturn-Neptune alignment will be. Without any prior cases of the same alignment, we would have to expand our case criteria to include other alignments that may function in a similar way.
As it is, there have only been three previous Saturn-Neptune conjunctions in the past 120 years, although this amounts to a total of 7 if we include conjunctions in which one of the planets is retrograde. But overall, there simply isn’t enough data there to provide a compelling case in either direction. Here again, we would have to include squares, oppositions, trines as well as conjunctions in order to increase the sample size. Whether or not this widening of case criteria would be valid and appropriate given the different influences of these various aspects remains to be seen. In any event, I hope to tackle Neptune’s part of this double square equation in next week’s post.
