
![]() (3 May 2025) US stock markets extended their rebound last week on hopes of a possible trade deal with China. The market has staged a remarkable comeback since bottoming on April 7 amid Trump’s chaotic reciprocal tariff roll-out. Despite the rebound, it is unclear if stocks can stabilize here given the ongoing sources of uncertainty. While the administration is talking up the prospect of trade deals to soothe frayed investor nerves, failure to deliver any tangible results before the end of the 90-day pause period would further damage sentiment. Also the negative Q1 GDP number is evidence that a recession may now be underway given the decline in trade that has already occurred in Q2. The collapse of crude oil prices under $60 suggests that markets are discounting an economic slowdown for 2025.
(3 May 2025) US stock markets extended their rebound last week on hopes of a possible trade deal with China. The market has staged a remarkable comeback since bottoming on April 7 amid Trump’s chaotic reciprocal tariff roll-out. Despite the rebound, it is unclear if stocks can stabilize here given the ongoing sources of uncertainty. While the administration is talking up the prospect of trade deals to soothe frayed investor nerves, failure to deliver any tangible results before the end of the 90-day pause period would further damage sentiment. Also the negative Q1 GDP number is evidence that a recession may now be underway given the decline in trade that has already occurred in Q2. The collapse of crude oil prices under $60 suggests that markets are discounting an economic slowdown for 2025.
The rebound in stocks reflects improving planetary conditions. As I suggested last month, there were several reasons why we would see a rally in April and May. First, the conjunction of Saturn and the mean North Lunar Node (aka Rahu) on April 14 was likely to end a period of volatility and pave the way for positive market performance. While both Saturn and Rahu are natural malefics, a statistical study of previous Saturn-Rahu alignments showed a surprisingly clear bullish bias the 60-day window of this conjunction. However, our study also highlighted some elevated downside risk in the 1-2 weeks before the April 14 exact conjunction. Amazingly, this came to pass in spades, even if the huge tariff sell-off greatly exceeded the average size of the decline in the lead-up to the conjunction.
While I have been skeptical that the S&P 500 could fulfill the average return of the 30-day period after Saturn-Rahu conjunction, it seems that the market is on the verge of doing just that. As I wrote in my Empirical Astrology Substack on April 20: “if the current Saturn-Rahu conjunction adheres to the average in the sample, it would predict an S&P 500 of 5779 [by May 14]. I’m not holding my breath on reaching that target, although the broader scope of the study does offer some evidence that a rebound is more likely in the 30-day period following the exact conjunct (April 14). Well, we’re almost there as the S&P 500 closed Friday at 5686. There is nothing particularly special about the May 14 date: it is just 30 days from the date of the conjunction. I selected the 30 day interval arbitrarily in order to get a general sense of how the markets reacted in the aftermath of the Saturn-Rahu conjunction. While I have no idea if stocks will end up near 5779 by May 14, the strength of the current rebound suggests that stocks could at least remain in that general vicinity, thereby once again fulfilling the prediction of the bullish aftermath of the Saturn-Rahu conjunction.
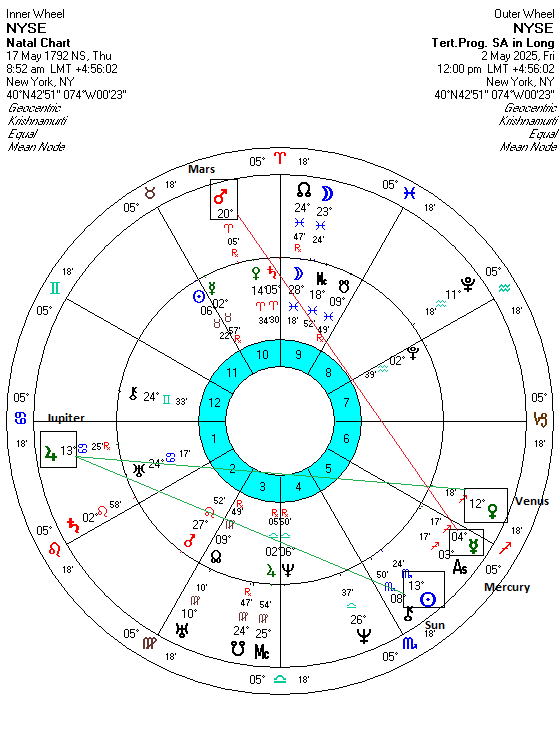
Secondly, the tertiary progressed NYSE chart is currently bullish. Tertiary progressed Sun formed an exact trine aspect with Jupiter on Friday, May 2. This was a big reason why on April 5 I wrote that a significant rally was likely to take place in April and into May. But since the alignment was exact on Friday, does this mean that the rebound is now over? Maybe not. While the stronger part of the rebound is likely behind us, there is likely to be some residual bullish influence from this progressed Sun-Jupiter alignment. Also, I would note that the approaching 150 degree alignment of Venus and Jupiter is still one degree away from being exact. This could translate into further gains in the month of the May. That said, the Venus-Jupiter alignment does not look as strong as the Sun-Jupiter alignment since the 150-degree angular separation is considered somewhat less bullish than 120 degrees alignment.
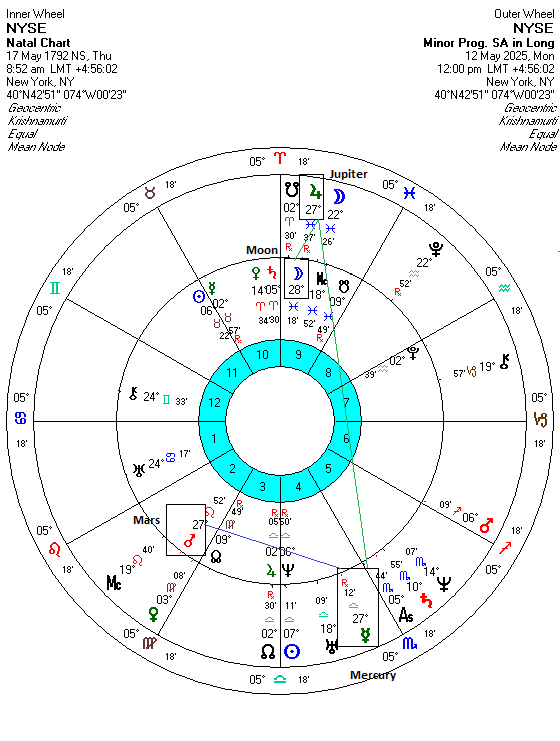
Thirdly, the minor progressed NYSE chart is also bullish. Progressed Mercury forms a close 150-degree alignment with progressed Jupiter, while Jupiter it in a close conjunction with the natal Moon. However, there could be a lessening of bullish influence once progressed Mercury turns retrograde on May 12. Even if the Mercury-Jupiter alignment will remain close and thus somewhat positive, the reversal of Mercury’s direction is bearish and its gradual separation from Jupiter will begin to accelerate in the subsequent days. This suggests that bullish energy will likely weaken in the second half of May.
Fourthly, the current transits to the NYSE chart paints a similarly bullish picture. Uranus (2 Taurus) is conjunct Mercury and in a 150-degree alignment with natal Jupiter symbolizing high energy and rapid positive change. Jupiter (28 Taurus) is in a close 60-degree sextile aspect with the natal Moon reflecting an increase in confidence an optimism. On Monday, May 5, Chiron (0 Aries) and Mercury (28 Pisces) will conjoin the natal Moon and form a larger alignment with Jupiter and Uranus. This is a broadly bullish transit setup that suggests we are likely to see further gains in the upcoming week.
![]()
The rally could well extend into the following week since the Sun is due to conjoin Uranus on May 16. This will once again act as a trigger for the broader alignment of Jupiter, Uranus and Chiron which is activating the natal Moon, Mercury, Jupiter and Pluto of the NYSE chart.
The outlook may become more mixed after that, however. Returning to the tertiary progressed NYSE chart, we can see that Mercury (4 Sagittarius) is forming a near-exact 135 degree alignment with Mars (20 Aries). While this is not a major aspect, it is close enough to coincide with some weakness. And we should note that since Mercury is approaching its retrograde station in late August, its slow velocity will keep this alignment within effective range for several months.
On the positive side, the tertiary progressed Venus-Jupiter alignment will be a bullish influence that could last into late May or early June. Whether it is sufficient to keep markets rising remains to be seen, however. While not conclusive, it nonetheless offers some decent evidence for a retest of the February highs above 6000 SPX in the coming weeks.
