
Total Trend 1 day ago 1 week ago
43 Neutral 56 46-54
Bearish 0-40; Neutral 40-60; Bullish 60-100
Comment: Bears in control so far this week
US Stocks dipped for a second straight day even if most of the declines were confined to the NASDAQ. The higher FAI score of 56 did not reflect any significant boost in sentiment as the bullish Moon alignments may have only served to offset the full negative impact of the Mars-Mercury aspect.
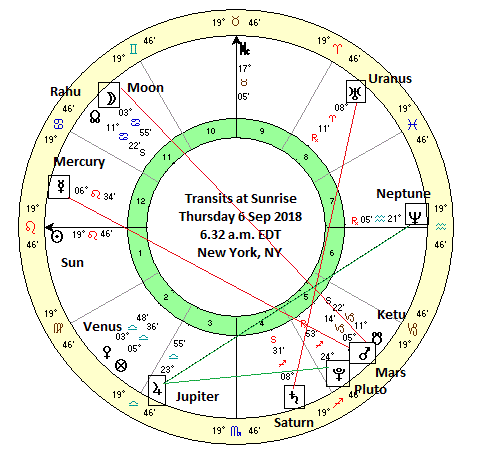
Thursday’s index is 43 and is significantly lower than Wednesday. The Moon-Mars opposition is an additional burden here. The Mars-Mercury aspect is separating so may be less negative. But the Sun-Neptune opposition may be an issue. The hits to the NYSE and NASDAQ charts look more negative than the transits themselves and increase the downside risk for Thursday.
Components:
Moon 8/20
Sun 5/10
Transit Alignments 10/25
NYSE Alignments 12/25
NASDAQ Alignments 8/20
Financial Astrology Index for Wednesday, 5 September 2018
Financial Astrology Index for Tuesday, 4 September 2018
Financial Astrology Index for Friday 31 August 2018
Financial Astrology Index for Thursday, 30 August 2018
Financial Astrology Index for Wednesday, 29 August 2018
Financial Astrology Index for Tuesday, 28 August 2018
Financial Astrology Index for Friday, 24 August 2018
Financial Astrology Index for Thursday, 23 August 2018
Financial Astrology Index for Wednesday 22 August 2018
Financial Astrology Index for Tuesday 21 August 2018
Financial Astrology Index for Monday 20 August 2018
Financial Astrology Index for Friday 17 August 2018
Financial Astrology Index for Thursday 16 August 2018
Financial Astrology Index for Wednesday 15 August 2018
Financial Astrology Index for Tuesday 13/14 August 2018
Background and disclaimer (Updated 4 Sep 2018)
Can market probabilities be reduced to a single number? Given the large number of planetary variables involved, it is very difficult to distill the relative balance of optimism and pessimism into simple numerical form. The Financial Astrology Index (FAI) is my attempt to explore this possibility. The index has a theoretical range between 0 (all bearish) to 100 (all bullish). Most of time, it should move between 20 and 80. Readings above 60 should be considered bullish, while readings below 40 are bearish. Readings between 40 and 60 are neutral.
It may be read in a similar way to technical indicators such as the RSI and Stochastics which show overbought and oversold conditions in the market. A number above 80 is very bullish and suggests a strong up trend. In some situations (e.g. near resistance, in a bearish market), this may also indicate a heightened risk of a reversal lower. Alternatively, a falling FAI in a rising market can create a negative divergence which may be an indication of rising downside risk. Conversely, a rising FAI can set up a positive divergence against a backdrop of a bear market or market correction. This divergence could be signal that a rebound may come soon. The trend in the FAI is at least as important as the actual value in terms of understanding possible future price patterns.
As always, it is not intended as a substitute for established stock market technical indicators. If anything, it is intended to stand alongside them and should be treated as an additional source of information — just another tool in the investor’s toolkit.
Fair warning: this is still experimental and more of a work-in-progress. I will likely be tweaking the relative weights of the different factors as I go.
By way of disclaimer, let me state the obvious: do not use this index as a stand-alone method for investing. There are simply too many unknowns in astrology. Astrology is best used as a supplementary source of information in tandem with other technical and fundamental approaches. This is not to be taken as investment advice. For informational purposes only.
