 (28 April 2013) Eclipses have a pretty bad reputation. In traditional cultures, they were seen as harbingers of doom and destruction. Solar eclipses in particular were feared the most as the sun’s light was suddenly and unpredictably lost as day was turned into night. Not surprisingly, humans made the symbolic connection between the interruption of the sun’s light with the notion of the interruption of the status quo in life. Thus, eclipses were associated with the chaos and uncertainty of all manner of natural or man-made disasters.
Fortunately, modern astrology has substantially evolved its view of eclipses. While eclipses are still seen as potentially important celestial events they are not seen as inherently negative or malefic in nature. If an eclipse falls on a benefic point in a natal horoscope, for example, it can coincide with a positive event. But one element of eclipses that endures today is the notion of change and interruption. Eclipses are still seen as marking periods where a change in the status quo is more likely, depending on the specific charts involved. Of course, change can be a good thing in an individual’s chart (e.g. a new job) so it is important to see eclipses in this broader context.
Last Thursday’s lunar eclipse started the current eclipse period. Eclipse periods last about two weeks and usually consist of one lunar and one solar eclipse. Eclipse periods occur every six months (or 177 days). The next eclipse will be annular solar eclipse on May 9-10 and will track across Australia and into the South Pacific. (see above map)
The conventional wisdom in financial astrology simply extends the popular view of eclipses and applies it to the stock market. Hence, eclipses are seen to occur when the prevailing trend is interrupted and status quo assumptions about the financial markets are subject to change. Eclipses are therefore often correlated with times of volatility.

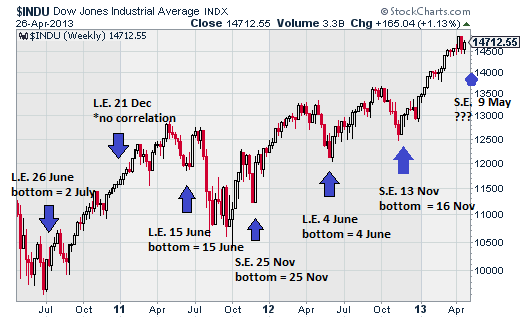
As the price chart above shows, the last six eclipse periods have correlated fairly well with this definition of volatility. Over the past three years, five of the last six eclipse periods have correlated quite closely with stock market reversals, that is times when stocks change their prevailing trend. Interestingly, all five of these correlated periods occurred at significant market bottoms. Stocks generally declined into the eclipses and then rose afterwards.
A couple of caveats are worth mentioning. First, I did not specify lunar (L.E) or solar (S.E.) eclipse for the market bottom. Since they occur two weeks apart and eclipses occur only every six months, I thought this was an acceptable margin of error in order to make the broader point. Second, it is quite clear that some of the market bottoms are merely short or medium term interim bottoms. They did not necessarily correlate closely with major low points in the market. In that sense, eclipses are not some kind of golden key for divining historic turning points in the market.
That said, the recent pattern of eclipses does suggest that some kind of trend reversal is more likely within a week or two of the midpoint of the eclipse period. Whether or not the reversal is the start of a lasting trend depends on other factors.
At the time of Thursday’s lunar eclipse on 25 April, most stock markets have stayed fairly high. The US market is within 1-2% of its all time highs, while Indian stocks have rallied strongly after a significant correction in February and March. If the dominant eclipse pattern plays out again, then one would expect a decline to begin very soon and to continue into the solar eclipse on 9-10 May. Some kind of interim bottom would then be formed around that 2nd eclipse date and the market will resume its upward climb.
Of course, eclipses do not only mark market bottoms. In August 1998, that month’s eclipse period marked the market’s high just before the decline that was sparked by the Asian economic crisis. So it is also possible that the current eclipse period (Apr 25- May 10) may coincide with a top of some kind and the market will experience a decline thereafter.
Perhaps the safer view is that we will see a trend change that interrupts the status quo around the time of this eclipse period. That would subsume both of the above-mentioned scenarios.

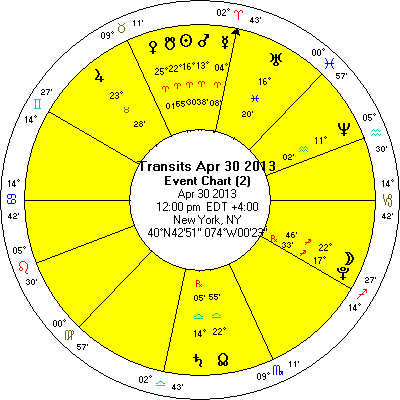
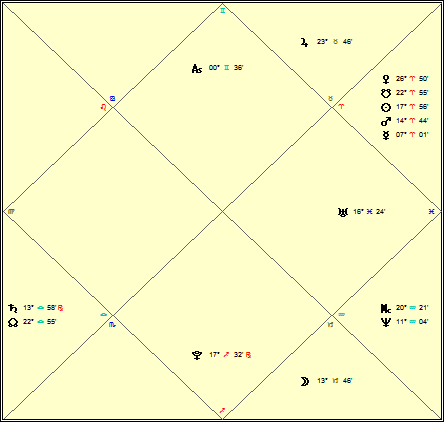
This week features a nasty-looking Mars-Saturn opposition aspect during the midweek that looks quite negative. While the markets have been quite buoyant lately, I think it will be harder for the bulls to dodge this planetary bullet. As it happens, there will be no shortage of potential news this week as the Fed’s Ben Bernanke is due to issue his latest economic proclamation on Wednesday while the ECB’s Mario Draghi takes the stage on Thursday.

Transits for Thursday 2 May 2013 Mumbai, India
You can be notified of new forecasts
if you follow MVA on Twitter.
investor newsletter which can be subscribed to here.
Please read my Disclaimer
Market forecast for week of 22 April 2013
Market forecast for week of 15 April 2013
Market forecast for week of 8 April 2013
Market forecast for week of 1 April 2013
Market forecast for week of 25 March 2013
Market forecast for week of 18 March 2013
Market forecast for week of 11 March 2013
Market forecast for week of 4 March 2013
Market forecast for week of 25 February 2013
Market forecast for week of 18 February 2013
Market forecast for week of 11 February 2013
Market forecast for week of 4 February 2013
Market forecast for week of 28 January 2013
Market forecast for week of 21 January 2013
Market forecast for week of 14 January 2013
Market forecast for week of 7 January 2013
Market forecast for week of 31 December 2012
Market forecast for week of 24 December 2012
Market forecast for week of 17 December 2012


